GDX & Updated Roadmap For Gold
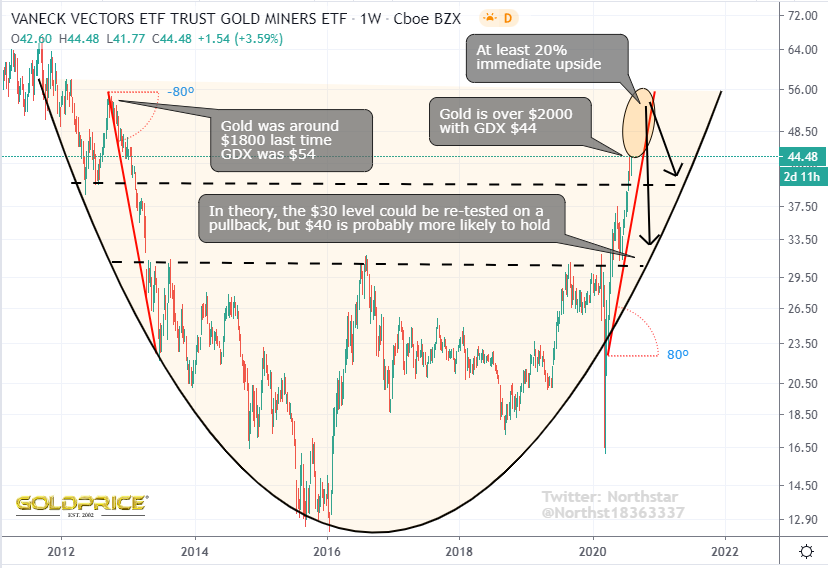
GDX is what has kept me from hitting that sell button so far – the chart is crying out that it wants to reach $50-$54 before correcting in a meaningful way. That would give around 20% more upside (the silver miners could be 30%+). It may happen in the next couple of days with gold closing in on $2100. I need to do more analysis, but that correction will come.
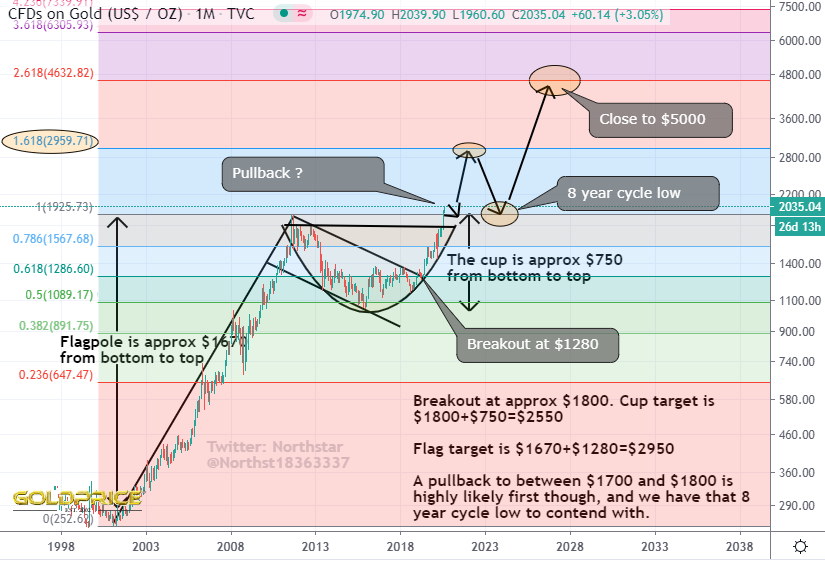
I have also updated the gold roadmap I posted earlier. It now includes a Fibonacci overlay which, quite incredibly matches those targets close to $3000. Weight of evidence is strongly pointing to that number. But when ? My current thinking is that once GDX achieves its target, we see a sharp correction (20-30%). After that gold should be free to climb to that $3000 target BEFORE the 8 year cycle low drags us back to $2000 in 2023 (remember, the drop into that low will start anything between 6 and 18 months before the actual bottom is hit). That would mean a 30% correction – very similar to what happened in 2008 (expect a global crisis). After the 8 year cycle low, it’s up all the way to (perhaps) $5000, but that is pure speculation at this point. We can reconsider all of this once we reach $3000. Hope this helps, and also worth remembering, all of this is my considered view of the MOST LIKELY outcome – there are other, lower probability scenarios. As long as we continue to chart and trade the data in front of us, and avoid fanciful theories/hype/opinions, the picture will remain clear, with the map laid out for us to navigate.
I’ll take it !
Sold
The symmetry you display on gold’s rapid ingress and egress (80 degrees) is just amazing!
Hi JimBob – it gives a useful guide. Symmetry doesn’t always play out, but it’s always worth considering. Appears to have worked very well on this occasion.