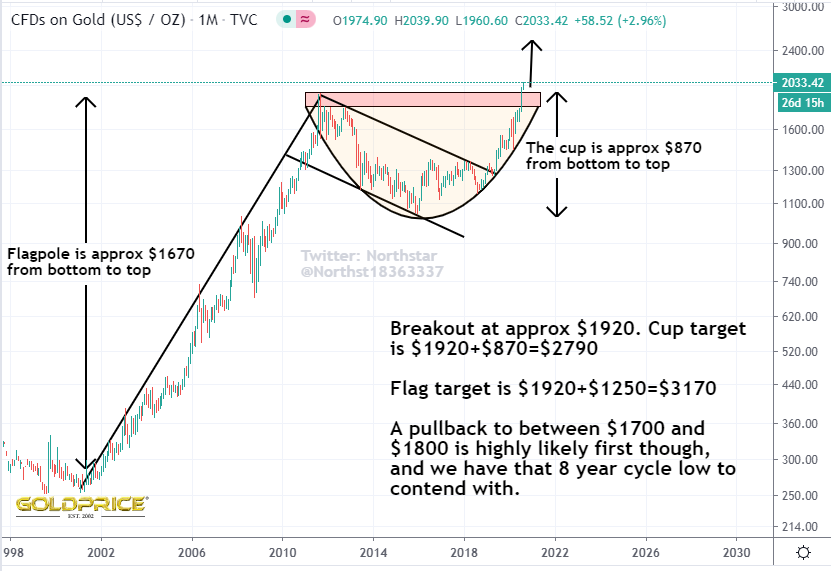
Two Simple Chart Patterns – One Huge Implication
As you know, I’ve been posting this chart for a long time. It became THE gold chart to watch in June 2019 when price bounced off the arc AND broke out of the flag. This confirmed the validity of both patterns. The rest is simple mathematics, and tells us, in very clear terms that the current leg (prior to the drop into the 8 year cycle low) will take us to between $2790 and $3170. We then drop into that big 8 year low. I expect a 30% drop, taking us back to $2000 in 2023. The next leg up after that should be huge, taking us to $5000 at least.
Thanks, Northstar. Have you gone all back in again with gold stocks?
More or less all in, kept about 10% ‘dry powder’
Thanks! I went into a couple of uranium stock that you recommended, and they are doing well, but the silver stocks seem to be poised to skyrocket now.
Hey NS, don’t look now but they are running hard again now!
Yikes! Aurum, it’s unbelievable! Now, I’ve got to chase a couple I let go. NOOOOO!
Get what you need to MJ and don’t let go. I am not trading around this market. Since I bought back in late March I am holding on tight! Hasn’t been easy.