PM Sector Summary
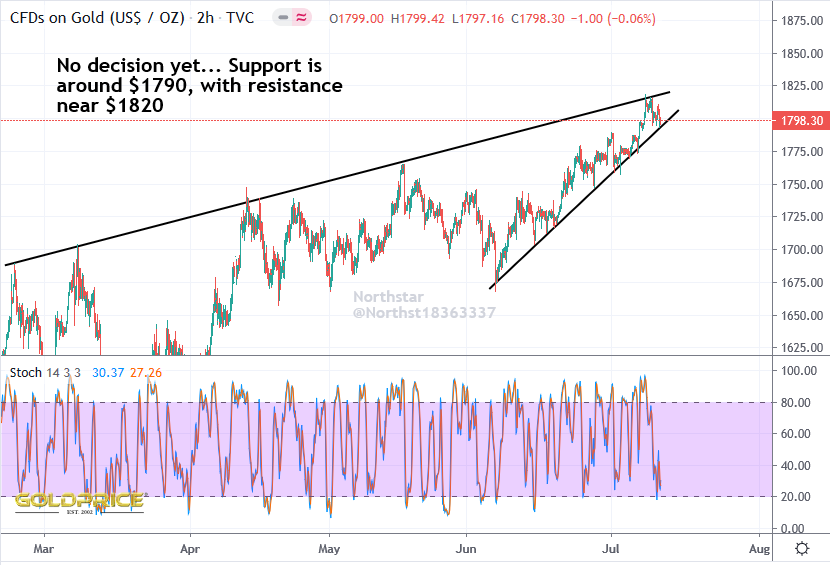
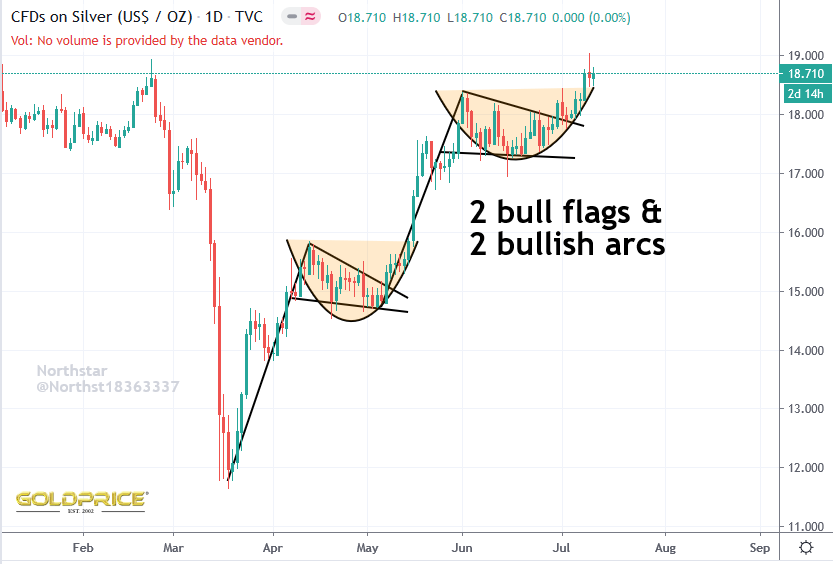
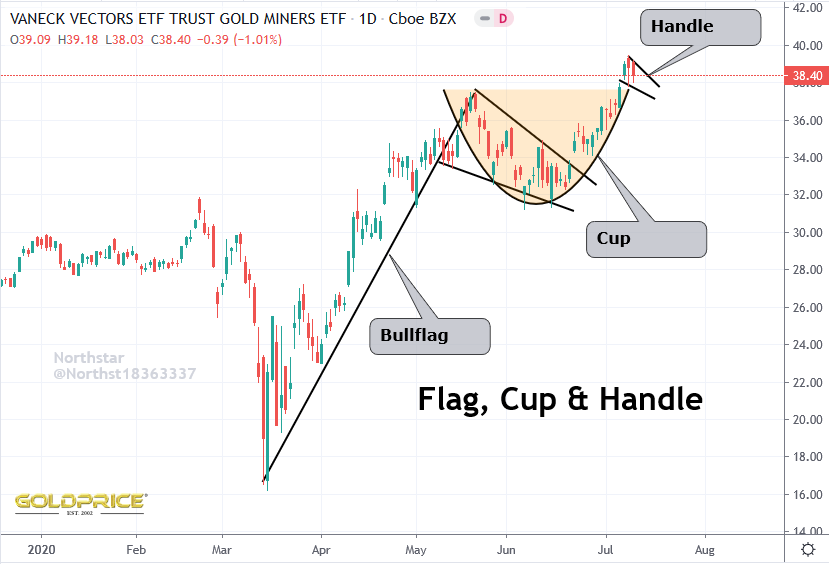
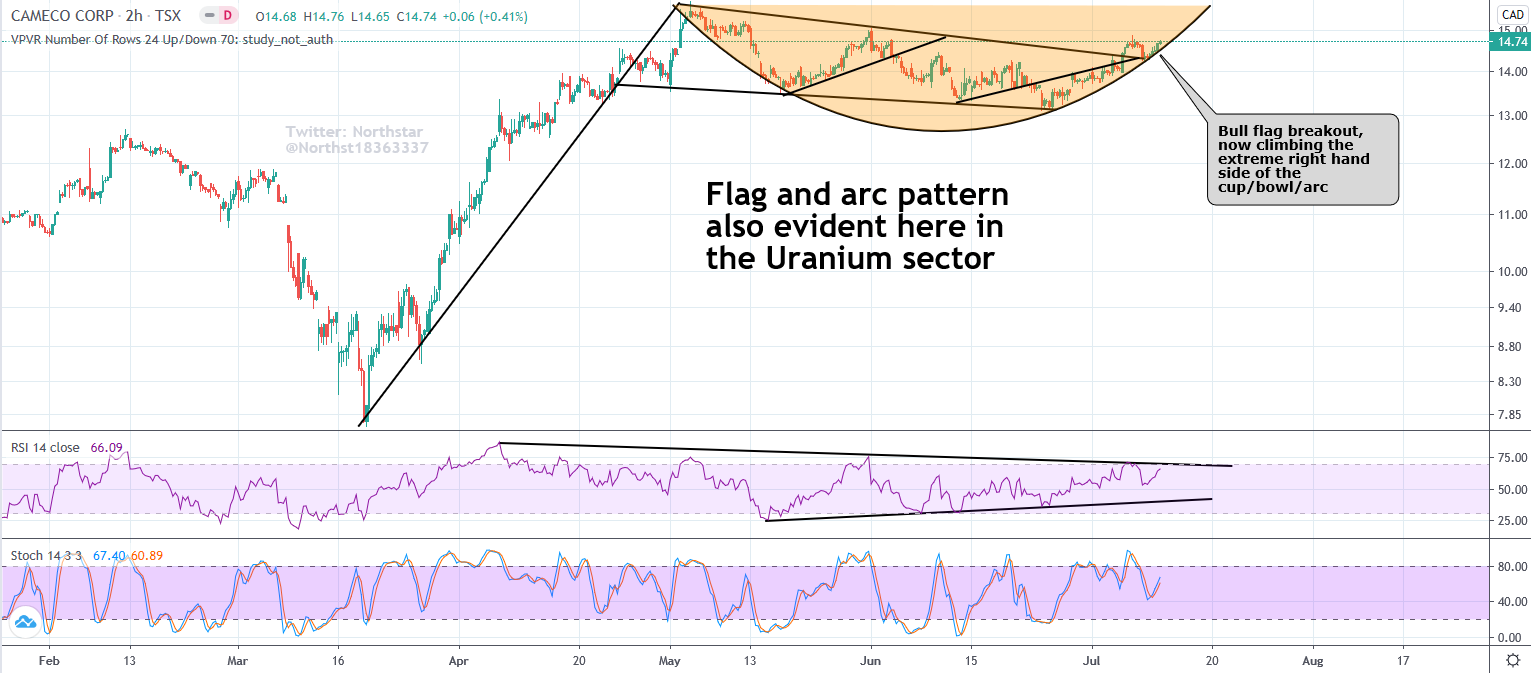
…and a bonus chart from the Uranium sector. Next week is probably the most important week this year. We’re going to find out if we get the ‘spike to $2000+’ or the ‘plunge’ It all hinges on a convincing move beyond the resistance line on my chart below. The resistance line is now moving directly to the level of the previous highest monthly close in the $1820-25 region. Funny how things line up isn’t it ? I don’t like the bearish rising wedge appearance to the recent move, so I’ll be ready to act fast (there are other ways to draw this chart, with a rising channel also a possibility, if you ignore the March panic drop). With that in mind, I have to say my bullishness is wavering. It would make a lot of sense to drop back to strong support in the $1600 region. All in all, considering spot failed to close above $1800 yesterday with some stretched indicators, I’m reducing my upside breakout probability to 60%, with the downside correction as an increased 40% probability. Remember, gold price is not too stretched above the moving average in historical terms – there is scope to move beyond $2000 before we get to that point. Also, the gold/silver ratio looks supportive of further gains. GDX is also part way through a reverse symmetry, measured move back to around $54. Quite a lot to think about, and plenty of reasons not to take your eye off the ball next week.
I have a lot on next week, but will post whenever I get the chance. Good luck.
Great commentary and recap! Thanks NS