Is The VIX Telling Us Something
From time to time I take a look at the VIX chart looking for possible turning points. We know things don’t repeat but often rhyme. The chart below shows a very similar pattern and length of time between lows from the Jan. – Feb. double bottom. If this plays out anything like then, some downside risk in the general stock market may be on the near term horizon. 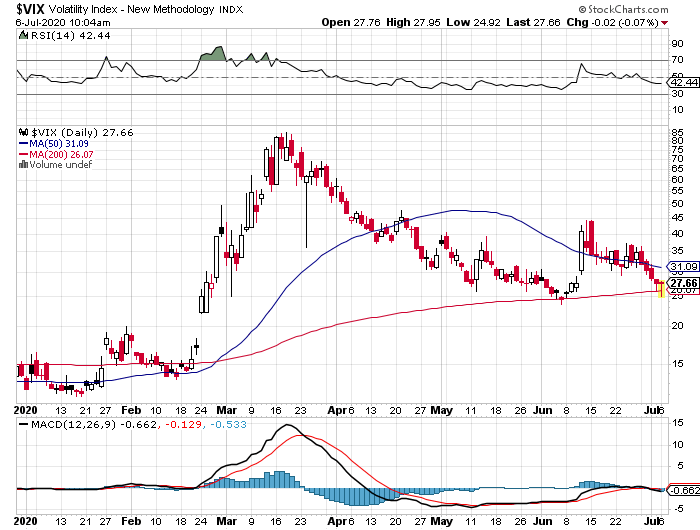
Fed better get printin!