A Cursory Study of TLT’s Relationship with $GOLD
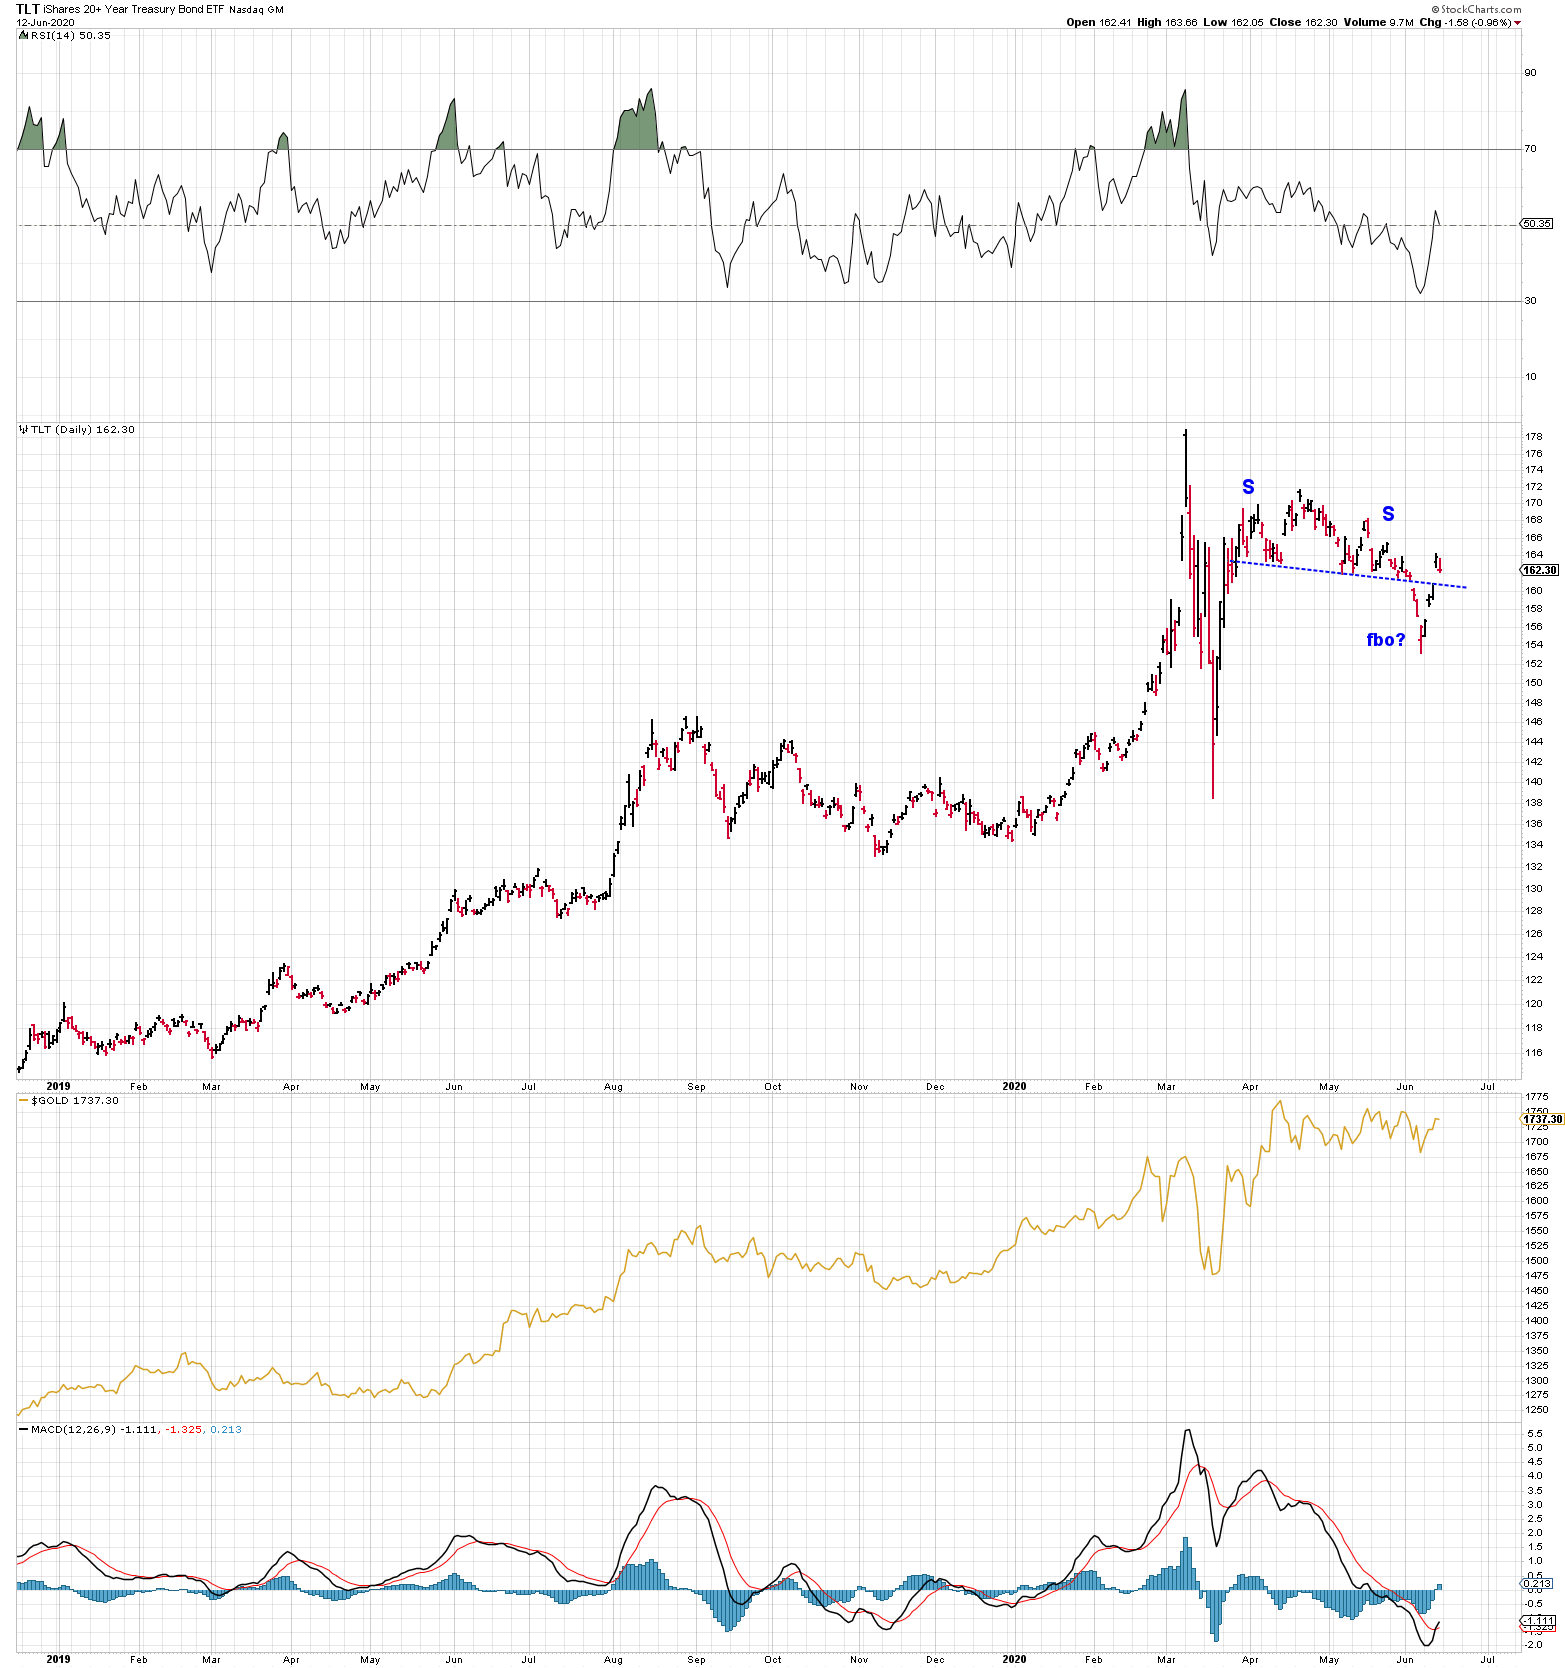
In a previous post we noted that TLT (20 year treasury bond) and $GOLD moved for the most part coincidentally. Today we notice GOLD is trading back inside its consolidation pattern, and TLT is trading back above the neckline of a SHS pattern. It seems $GOLD and TLT are twins, at least for the time being. We don’t know yet if we have just a hard back test and a subsequent failure to hold, or if TLT will stick above the neckline.
TLT – Daily
Do TLT and $GOLD always more or less in SYNC? On the monthly chart we look back to mid 2002 when TLT was born. The yellow highlighting shows the years TLT and $GOLD traded in sync, the bull years for GOLD. We see a period of about 5 years (blue highlight) where the pair are not in sync during what we might call non bull years for GOLD. So the correlation doesn’t always hold.
Notice the TLT break above the top rail in March 2020, and subsequent pull back to the trend line. That action looks potentially bearish (at least to me)
Also TLT is massively overbought on the MACD oscillator, much more so than during the 2012 $GOLD peak. Interest rates are already zero bound. I suspect it could take negative interest rates to send TLT higher.
TLT – Monthly

Fridays drop in TLT was a big part of why I was negative on the miners late Friday. I bought JDST SOXS SPXU. I have several crews working for me on a property, all young millennial new traders who are trading Robin Hood doing really dumb things like trading bankrupt stocks who don’t have a clue.