Another Gold Update for Bikoo99
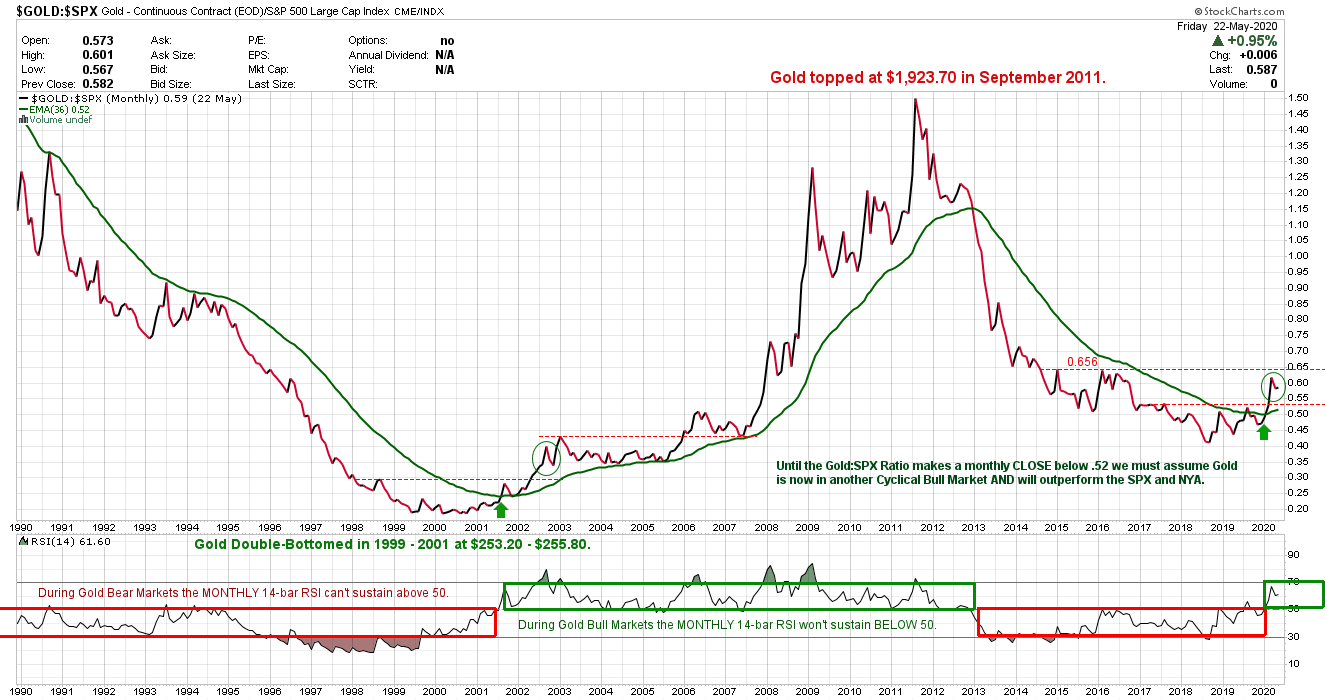
Thanks for posting that Monthly Candlestick chart, Bikoo99. Here’s my Ratio Chart of Gold vs. the S & P 500. The 14-bar RSI shows the same as on your chart. Notice also that the 36-Month Exponential Moving Average is pointing up – for the first time in a long time.
And you just drew the silver chart without knowing it! BEAUTIFUL!
Yes That means when gold out performs it is simply is silver chart.
Thanks nice charts. Learn everyday new things here.
Isn’t it beautiful when a moving average separates the ups from the downs on a chart perfectly? I’ve always suspected that moving averages reveal a hidden ratio of time and price for a market once you find the right formula, simple, exponential, etc… and the right period. Fully posted a chart for gold going back to the last bull market ending in 2011 and I think it was the 20month ema that perfectly separated the ups from the downs. Buy above and sell below the 20 month ema and no other analysis required! Your chart here is another great example. Thanks!