XLY:XLP
Rambus has a LOT of tricks in his bag. I can hardly believe how many charts and Ratios he is watching ALL the time.
His Weekend report contains a LOT of interesting charts with one particular obscure pattern as the theme
which is interesting enough but this one below really surprises the hell out of me
How do we explain this ?
……………………..
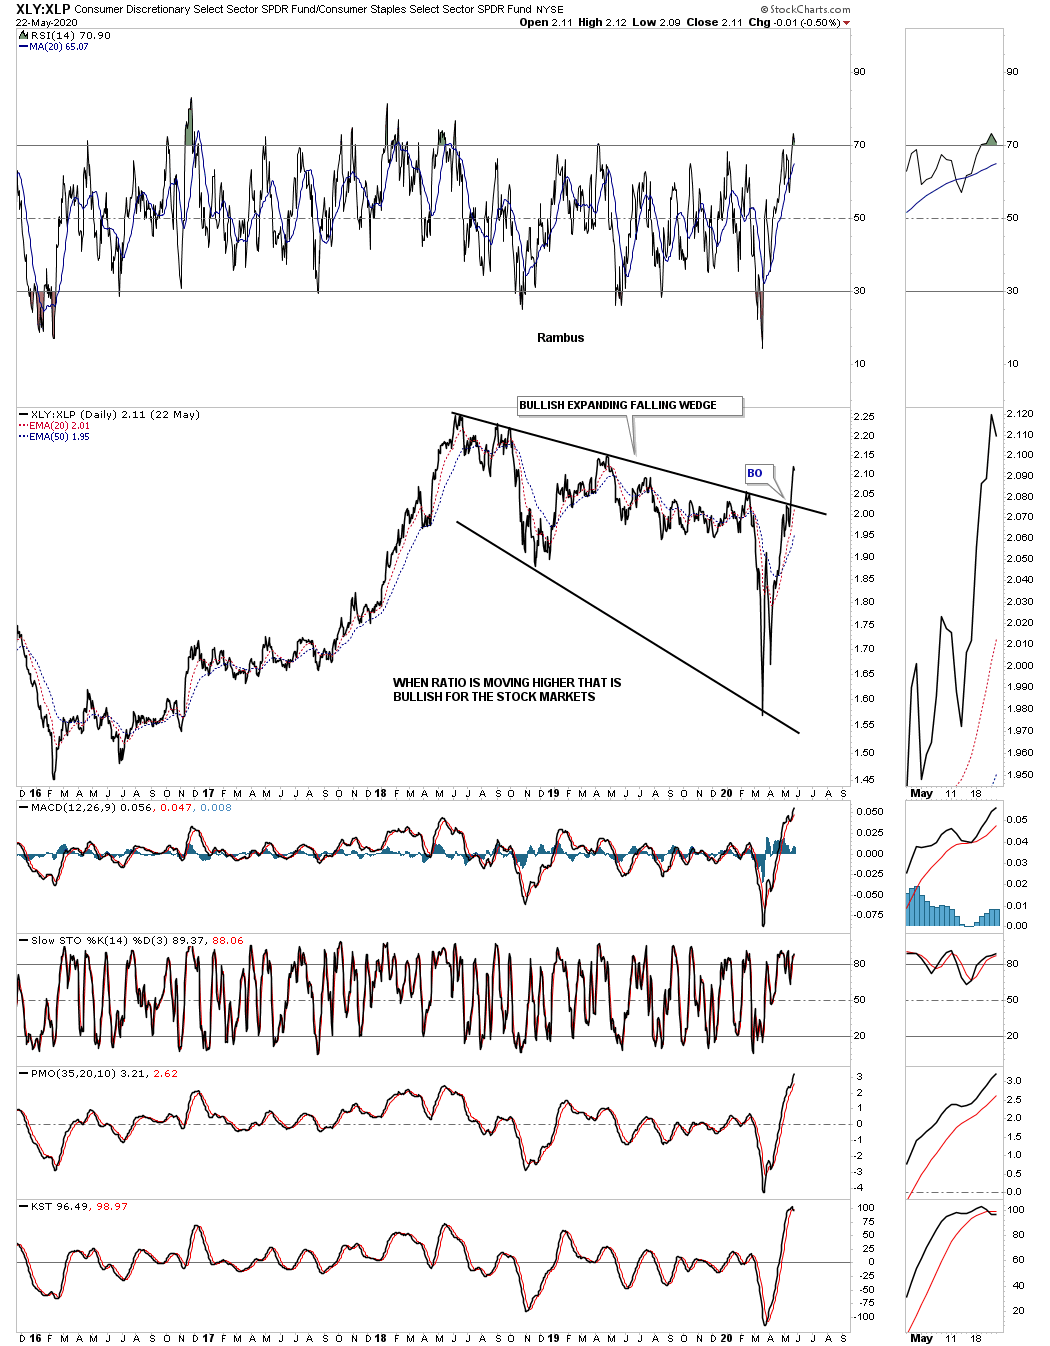
“Normally when the XLY ( Consumer Discretionary Stocks) is stronger than the XLP ( Consumer Staple Stocks) that is generally bullish for the US stock markets. Below is a 5 year ratio chart which shows the price action breaking out above the top rail of the bullish expanding falling wedge a couple of weeks ago.”
Rambus
………………….
This is Shocking to say the least !
How ..when we have are living through the most so economically destructive period in living memory.
When Whole Industries like RESTAURANTS HOTELS AIRLINES CRUISE SHIPS PROFESSIONAL SPORTS MALLS TOURISM OF ALL KINDS have been devastated and presumed to have been terminally damaged, can “discretionary” spending be greater than “necessary” spending going forward ?
Contrarian Market Wisdom has it that the Herd is always dead wrong at turning points…well the herd is expecting economic destruction the likes of which have never been seen
What IF everything really is going to be ALL RIGHT ?
sheesh
Combination of decent size stimulus checks, millions getting more for unemployment insurance than they were earning working, lockdown so no restaurants, casinos etc. so shopping online and buying discretionary items like Peloton bikes etc. Won’t last, also many getting delays on having to pay mortgage and or rent as well as credit card and student loan forgiveness, when the bills actually come due in a few months, discetionary will crash and staples will hold up because you have to buy food and toilet paper.