Crude Update
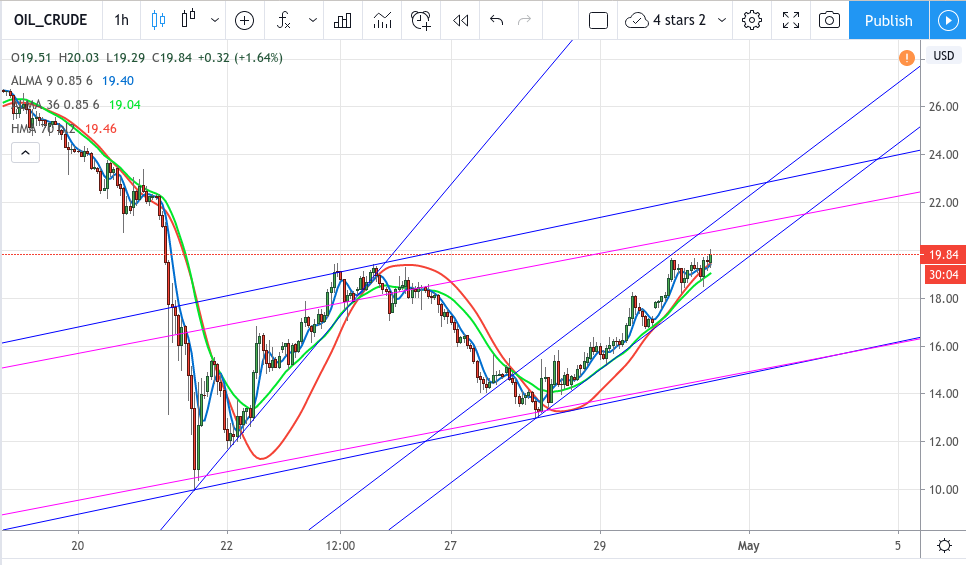
Thursday, Apr 30, 1130am (above)
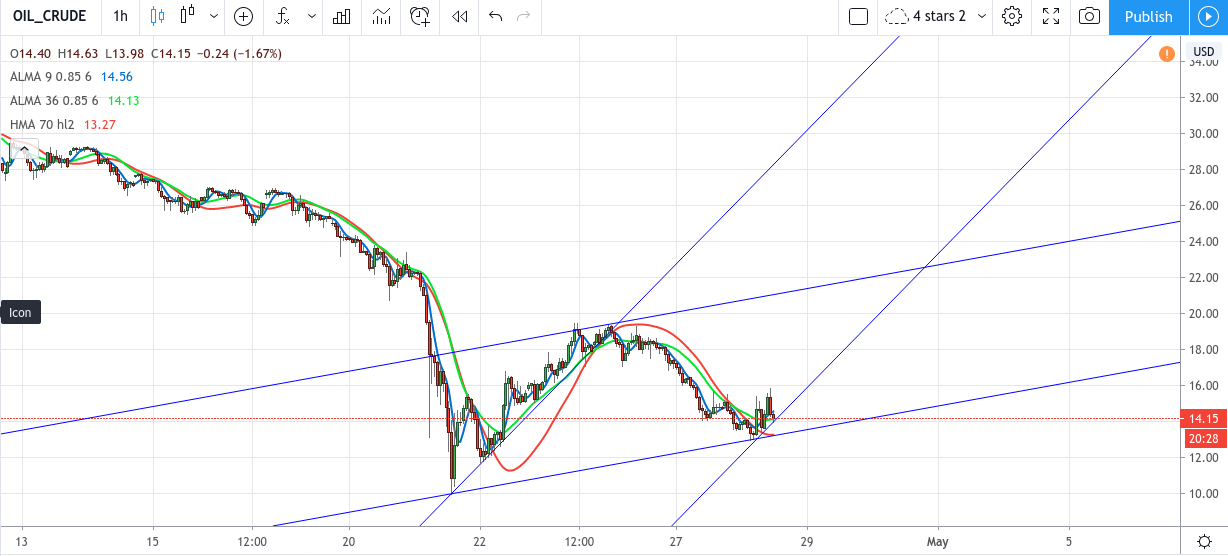
Tues, Apr 28, 11:39 am (above)
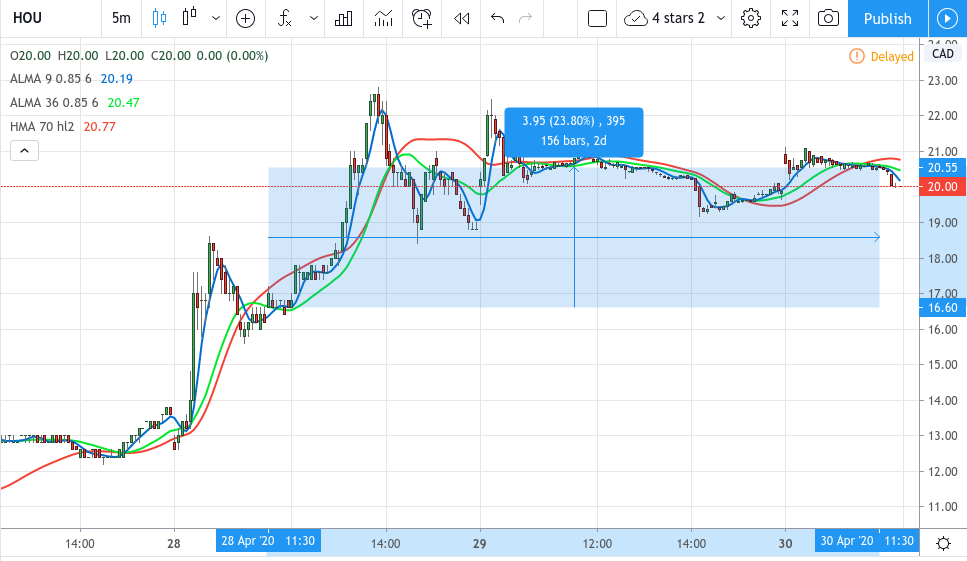
HOU 2x Oil ETF 23.8% gain (above)
Crude is up 35% from when I posted the first chart (bottom) two days, 48 hours ago. It’s also a little over the previous top and since you have to go back like 20 years or more to see price action at this low level… I’d say this is a good enough spot to chicken out and sell and start the weekend early! Things don’t usually work out this well for me. I usually hold on till I’ve lost all my gains, go negative and hope to get back to where I started. I changed the channel in the newer chart and made it lower to reflect the lower angle of the current trend. I think the top channel line might be too high but it fits so well with that price action at the bottom of it that I let it decide the top.
Just for fun, I added the 2x oil etf HOU (tsx) for comparison. Instead of 70%, it would have gotten you 23.8%. It might not be a perfect equivalent holding to WTI. Commodities can be complicated. HOU seems to be Sept contracts only. But it just goes to show that commodity ETFs are not the perfect way to trade commodities. What if the gain in Crude was only 15%? Would the ETF be negative? Or just 5%, 1/3 of what it’s tracking. Either way, it sure ain’t 2X!
Bought UCO yesterday and added more today. Plan to hold this many months until oil gets back to somewhat normal levels.
UCO doesn’t look bad at 17% over that two day period, 11am Tuesday to Thursday. I don’t know about the long-term outlook, though. Is it too much to imagine oil at $5 a barrel? “Normal” could be a long ways off. But I don’t think UCO suffers from decay, so as a long term holding you only have to consider market factors.
Wouldn’t want to hold this for years, but after things begin opening back up this summer, oil should rise significantly. I plan on holding for 3-5 months.