$Silver – Bull, or no bull?
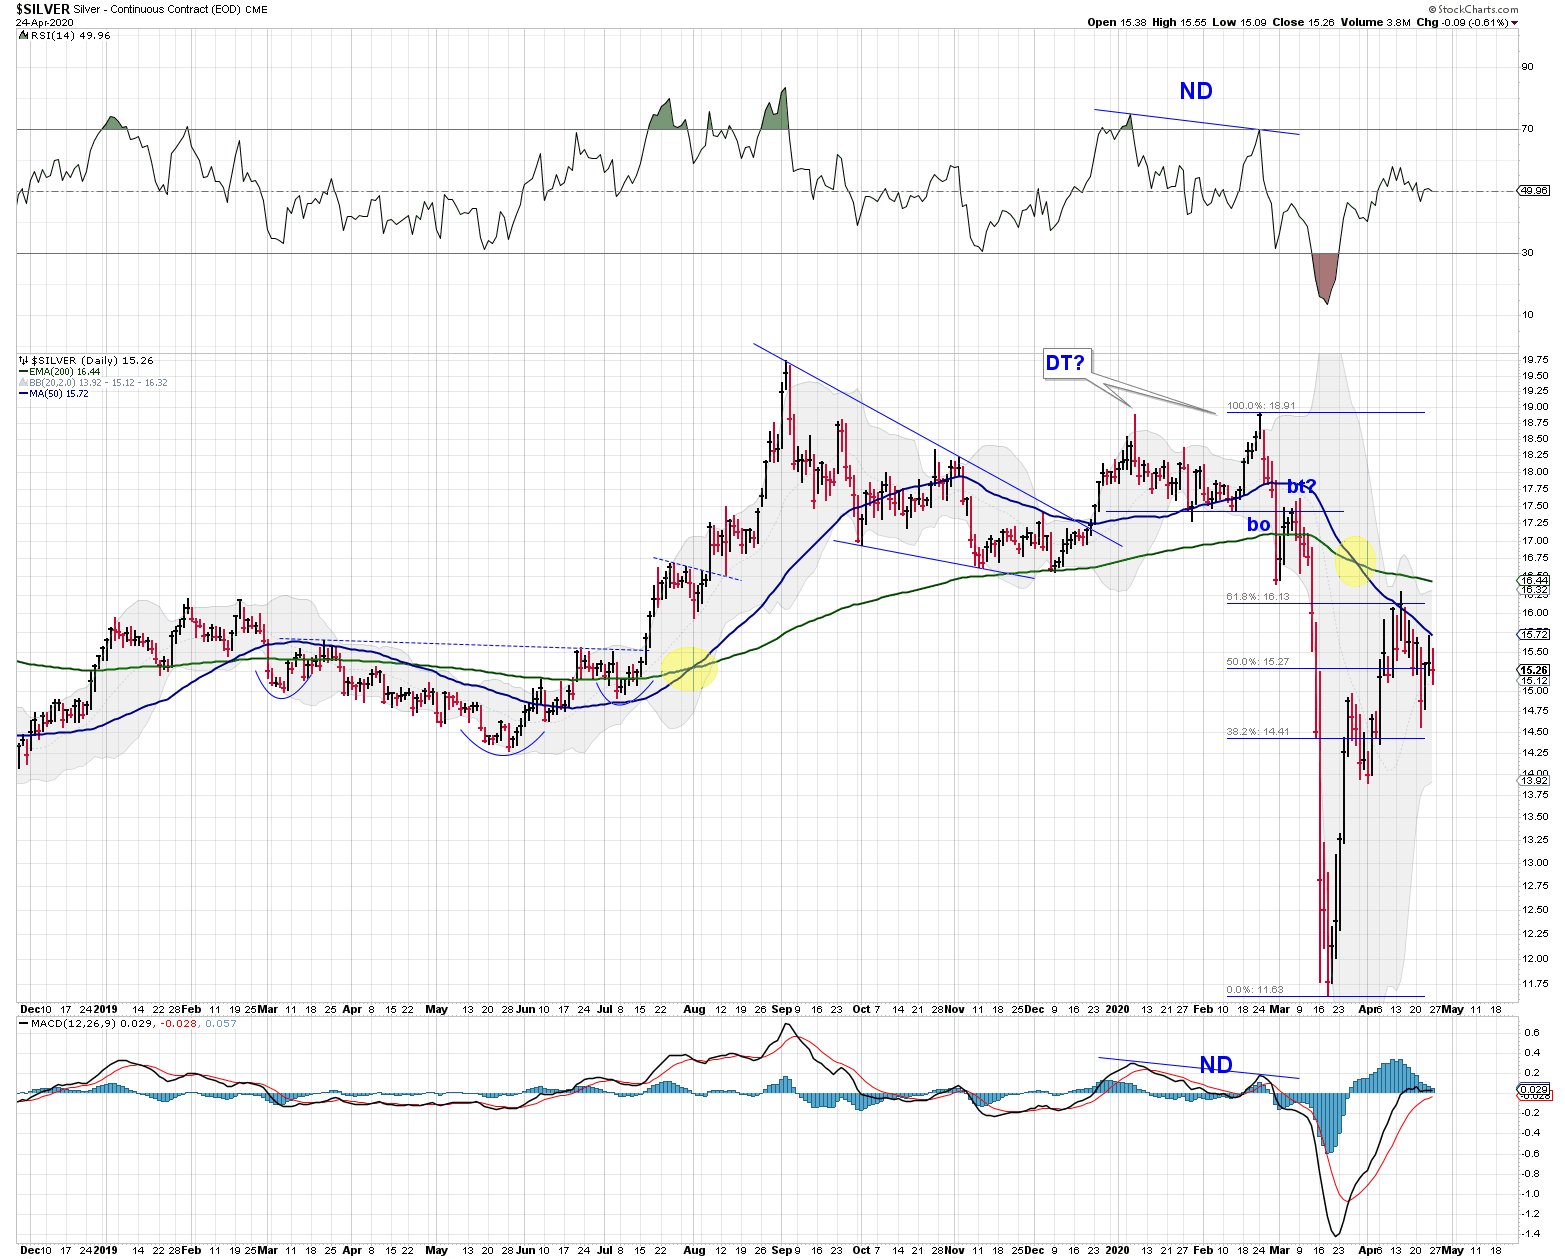
On a daily chart $Silver stalled at the Fibonacci 61.8% level. It has been unable to break and hold the 50 day simple MA.
The weekly $Silver chart suggests it completed a retest of the March collapse. Also notice rejection at the 30 EMA.
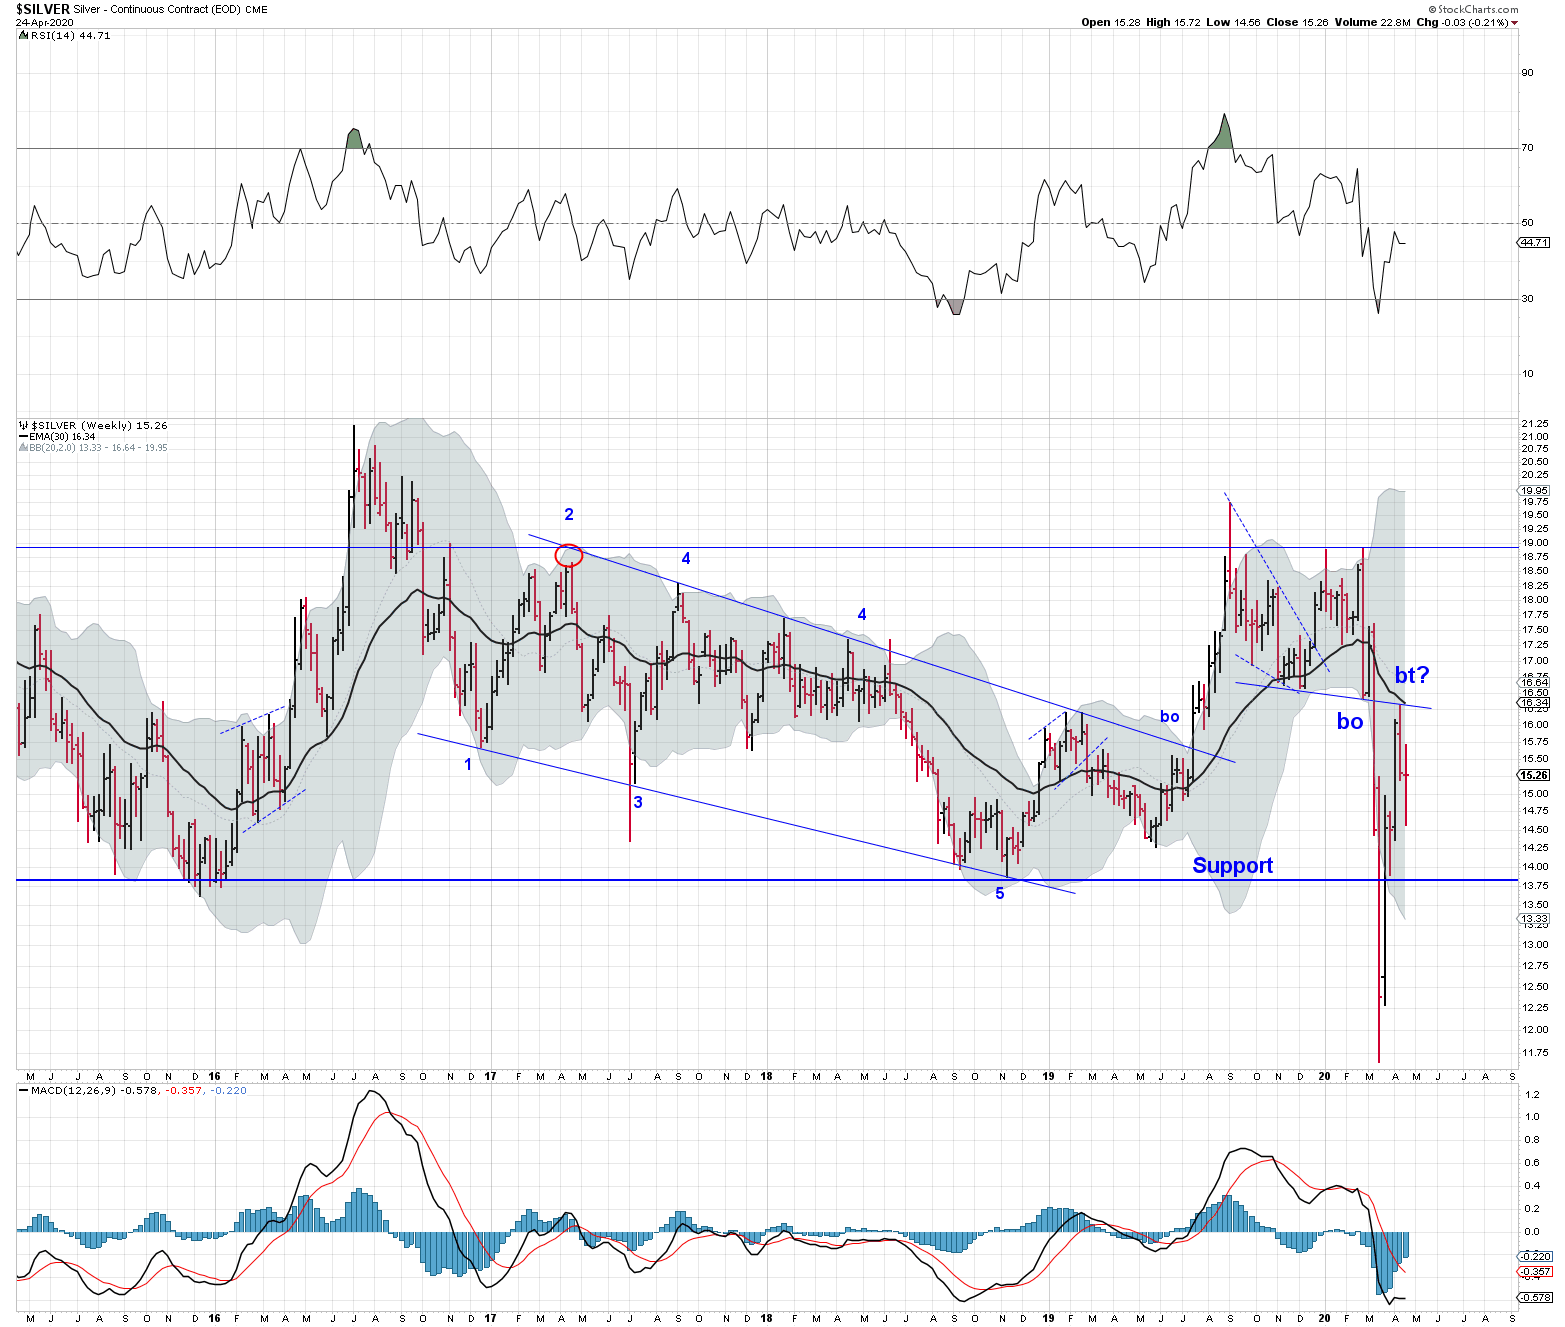
It “feels” like Silver needs to retest recent lows, maybe at least as far south as the support level – approx $13.80 as drawn on the weekly chart.
I suspect the drawn down in commodities is not yet complete.
Redraw your charts with eBay pricing! 🙂
Party Pooper Silverfox.
Actually you make a lot of sense.
IF the Stock markets ever let go Silver likely will as well
I did not expect this post to be popular.
Until $Silver breaks higher these are not bullish patterns.
It is what it is.
what’s wrong with Bob?
He’s a manic depressive.
Unpredictable
🙁