Master Piece #2
Here is FED Total Assets vs Gold Chart. I added actual Fed a balance sheet total. If same angle of ascent for ratio and nominal amount (as gold is barely moving)… May 25th should be a tipping point where market wakes up and says… OKAY THAT IS ENOUGH! And gold being to adjust upwards.
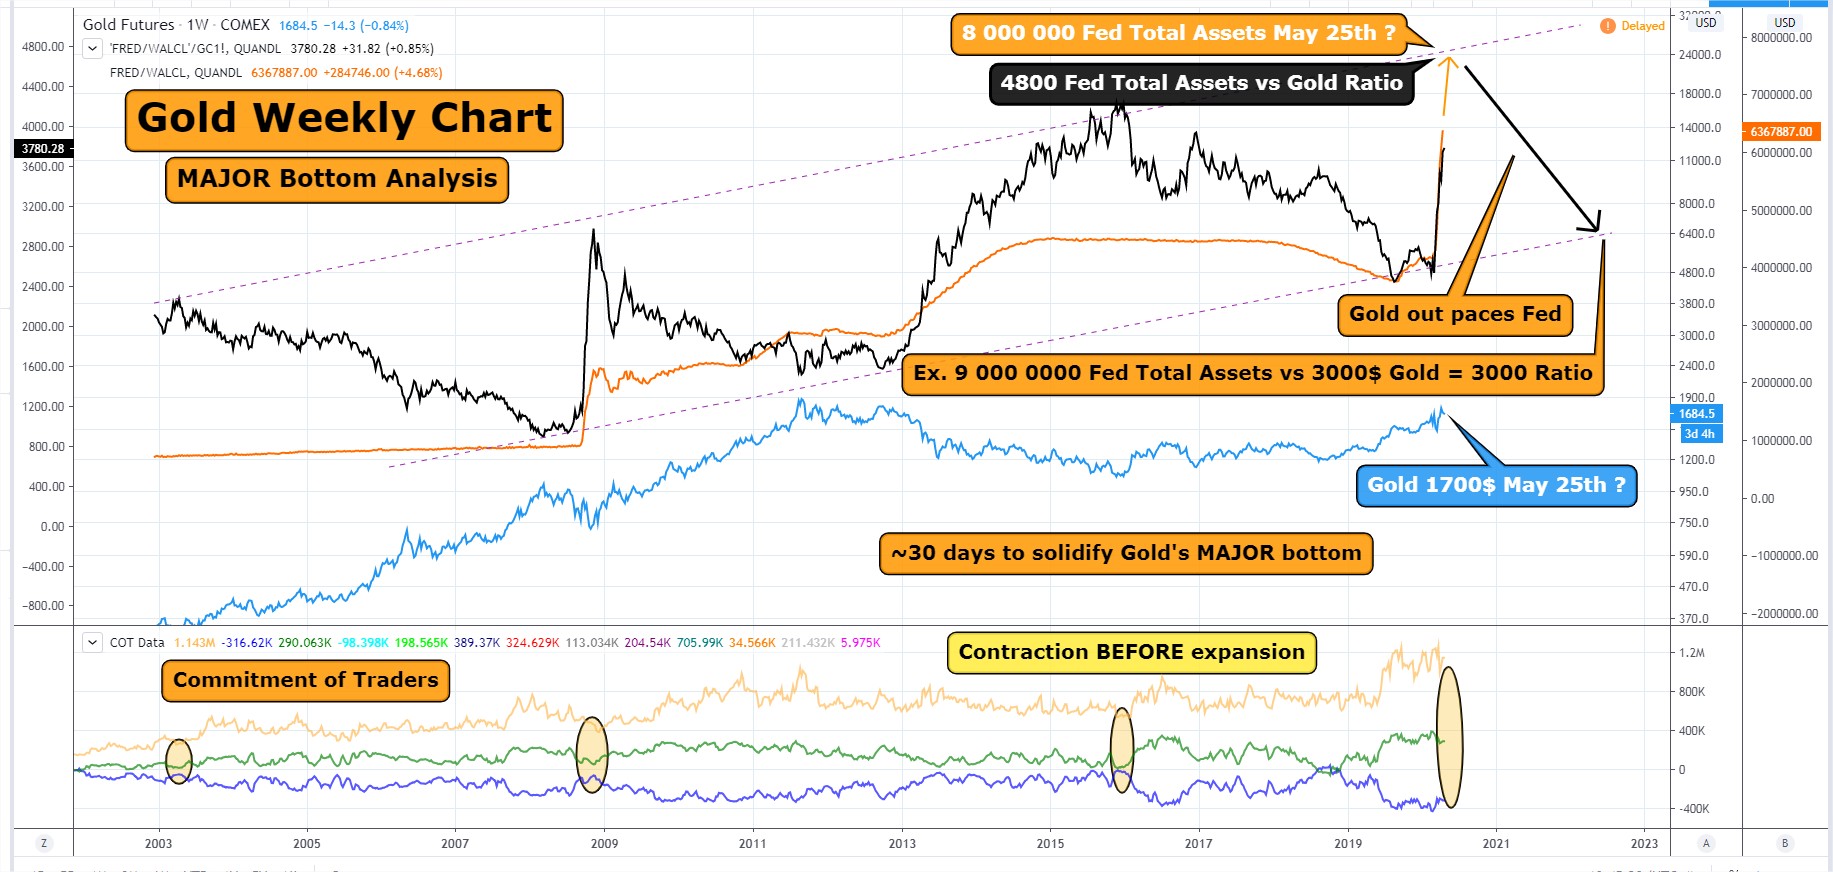
Adding supporting COT data at key bottoms in gold.
Errata: Another typo. One too many zeros on that Ex. 9 000 0000 should be 9 000 000.
Great stuff…You will be known as the New “Forecaster”
🙂
… not this kind of ‘Forecaster’ though:
https://vimeo.com/ondemand/theforecaster
ahhh. Has Armstrong ever posted at goldtent?
Chart telling market as the ratio rises gold declines. FED now is buying every thing there is risk gold should not be expected to rise??? Good chart. great you can access these data thru service.
When ratio goes down from top rail.. that is when I expect BIG gains in gold.. all the accumulated energy. Everybody that had given up on gold as a monetary “balance” will be left into the cold as gold finally prices in the excesses… and probably in excess!
Bikoo, what service ? the data is from quandl (and the fed itself) and tradingview permit me to fetch it through their api.
Current FED’s total asst is $6.6 Trillions.
yes… when it ratio hits top rail.. a strong gold bottom is in. Gold can decline ever soo slightly while that ratio goes up.. as long as fed keeps printing at current speed. And with bailout incoming for US oil companies.. could go up even faster. I have a May 25th 8 Trillion Total asset on balance sheet and a ratio of about 4800. Match yields a price of gold 1666$. So not much possible draw down for gold from here.