This Is Not A Normal Sell Off
As shown by $MUT’s monthly chart:
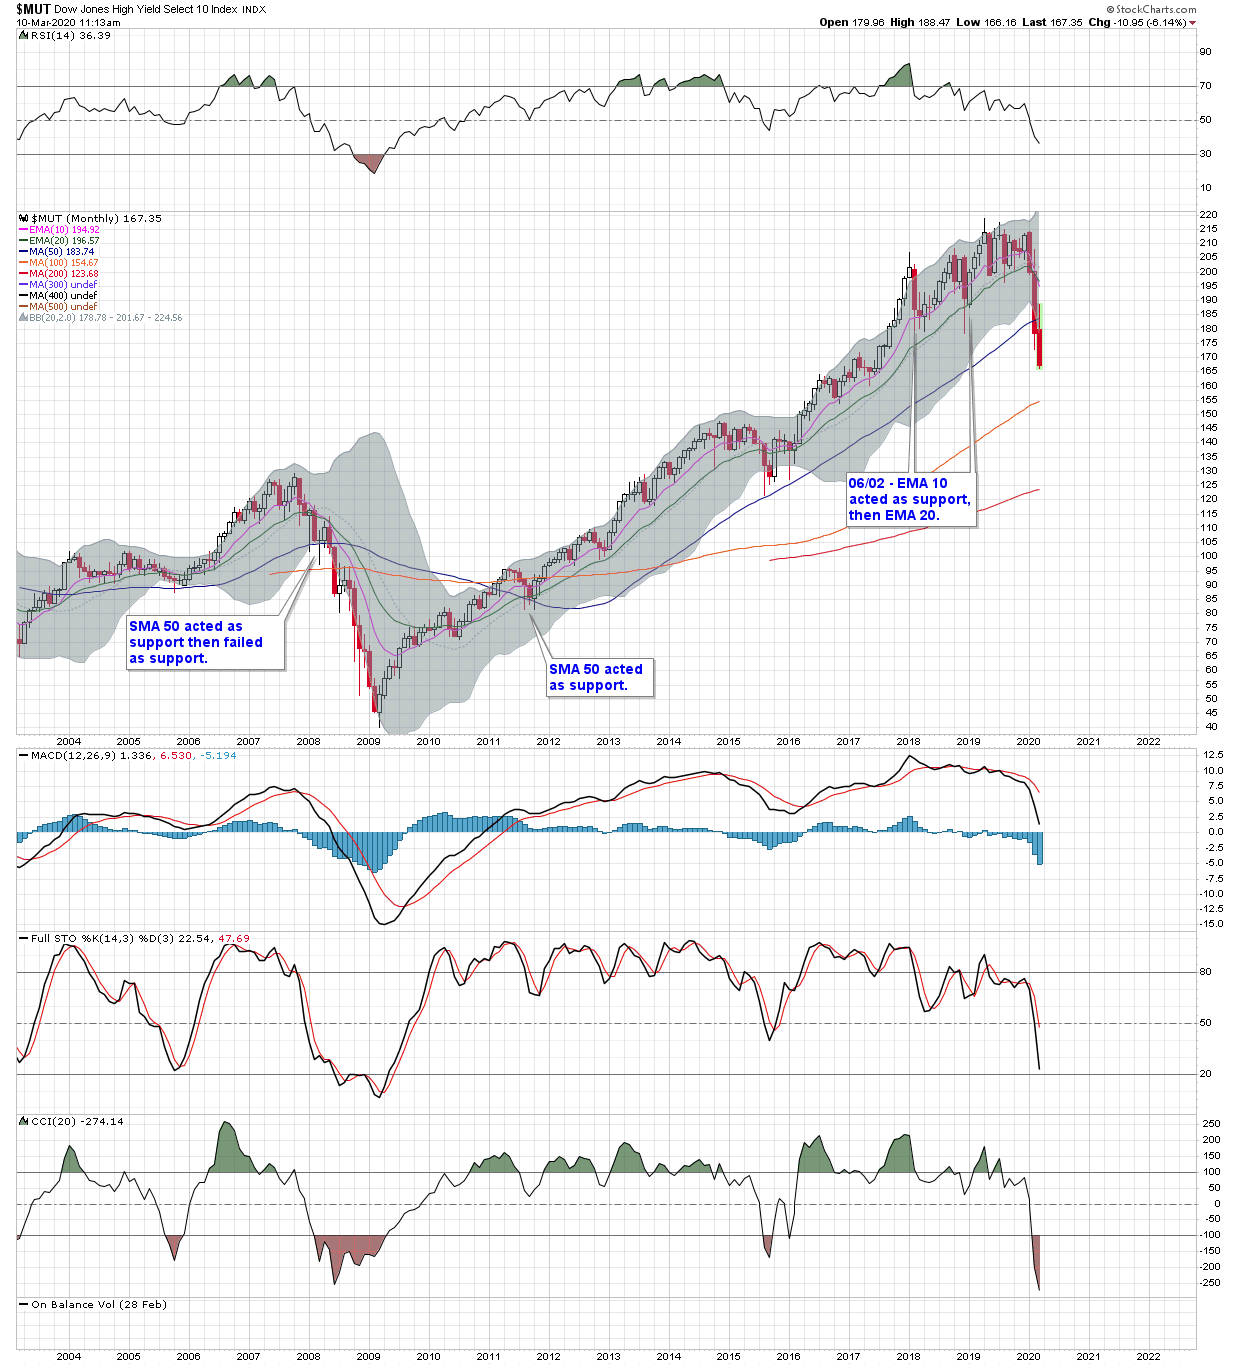
In the sell off in 2011, the SMA 50 acted as support.
In the sell off in 2015, price got close to, but never tested, the SMA 50 as support.
In the sell off in 2018, price never even got close to the SMA 50.
In the sell off in 2008, the SMA 50 initially acted as support, then that support level failed.
In this sell off, price has fallen straight through the SMA 50 like it wasn’t even there.
Yeah, technicals have ugly picture, which is not seen long time.
This is more like 2000, first leg down to 200MA, then never reached new high.
The gap we have seen 230 – 220 (~5%) from top, was not see anytime for the last 40 yrs.
It looks like this bull market in Nasdaq is over, with some kind of stimulus from Govt, it may reach 50MA daily, then roll over.