*Reflecting on Last Week…and the FED*
On March 1st, after the $127 slam to gold leaving a hook reversal on the Monthly Bar Chart, I posted this:
“Take a look at the three purple elipses on this monthly bar chart of Nymex Gold. In each instance the red monthly bars show a hook reversal. (Some would say a shooting star on a candlestick chart.) In either case it’s clearly bearish – but how bearish? Even though it’s not a key reversal like that of 2011 I think it does mean we’re not going to see a new high in gold for more than a few months, unless the Central Banksters panic next week and really roll the presses. But we’re truly in uncharted waters; no one knows and we can only play the odds as always. Right now the odds (to me at least) are saying the recent upleg is over – unless the Fed hits the print button.”
Well hit it they did with an intermeeting cut of 50 basis points to the Fed Funds Target, and the Spot Future of Comex Gold made a slightly higher high. Tonight it’s above $1,700. What will “Wild Jerry Powell” and gang do now with the e-Mini S & P 500 Futures locked limit-down? I’m sure glad I have a lot of physical and GLD.
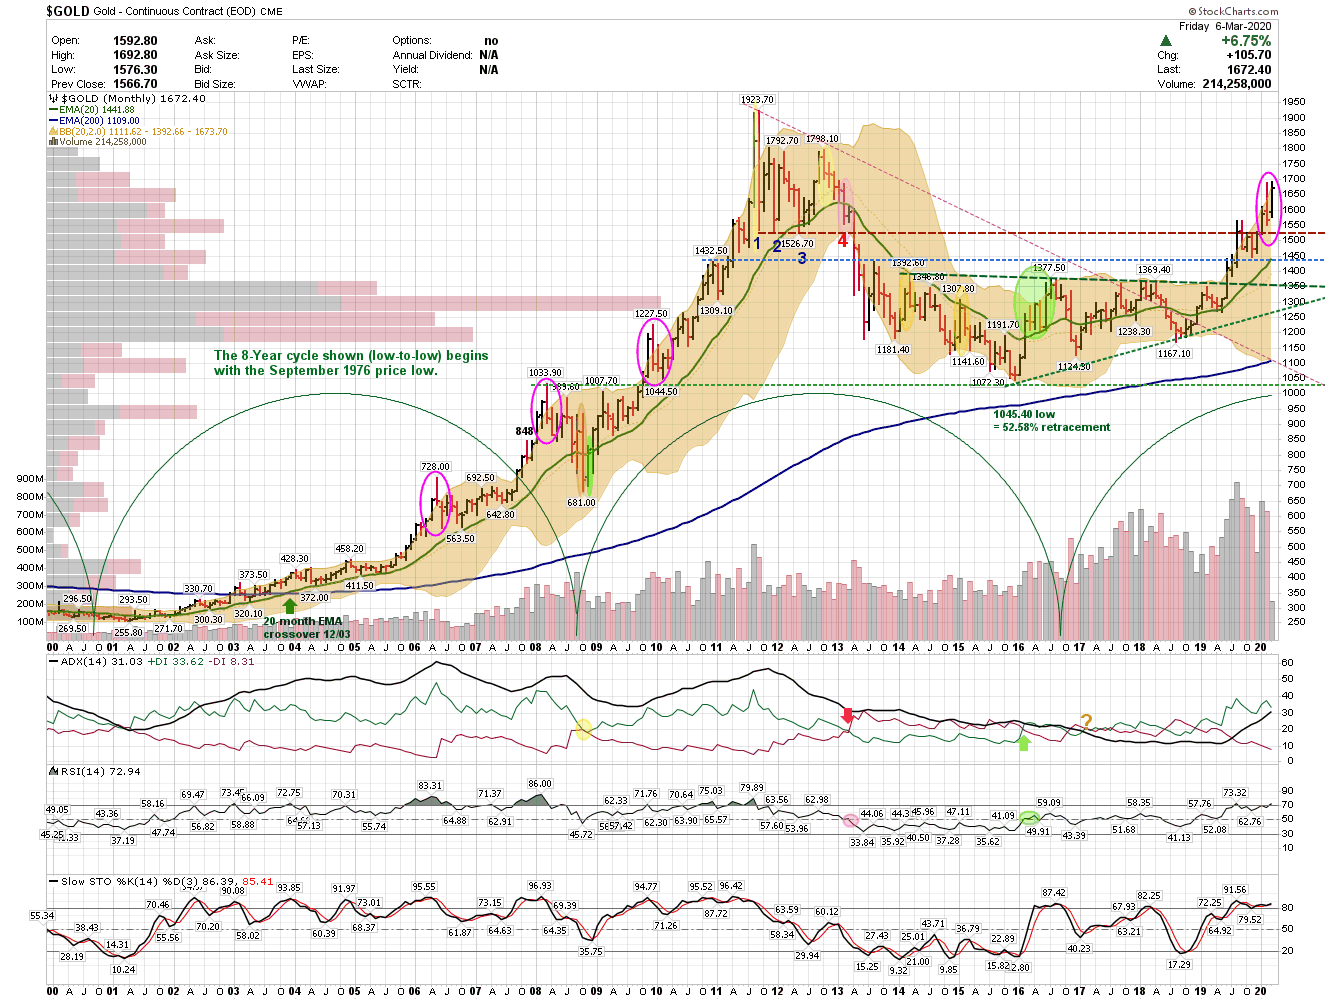
This is now a clear breakout on a VERY important chart, and unless it makes a reversal by the end of March Gold should have a looooong way to go on the upside.
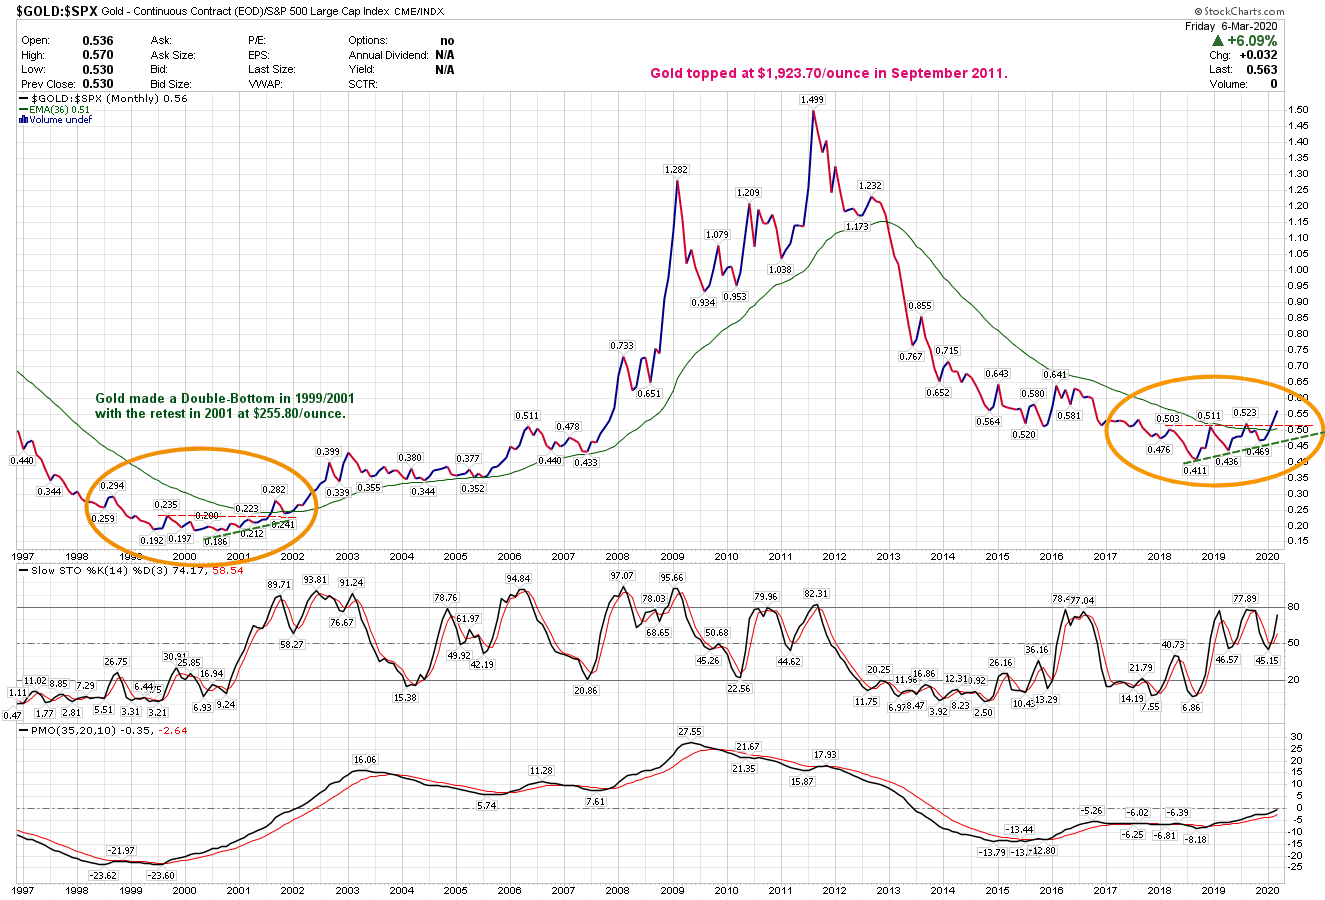
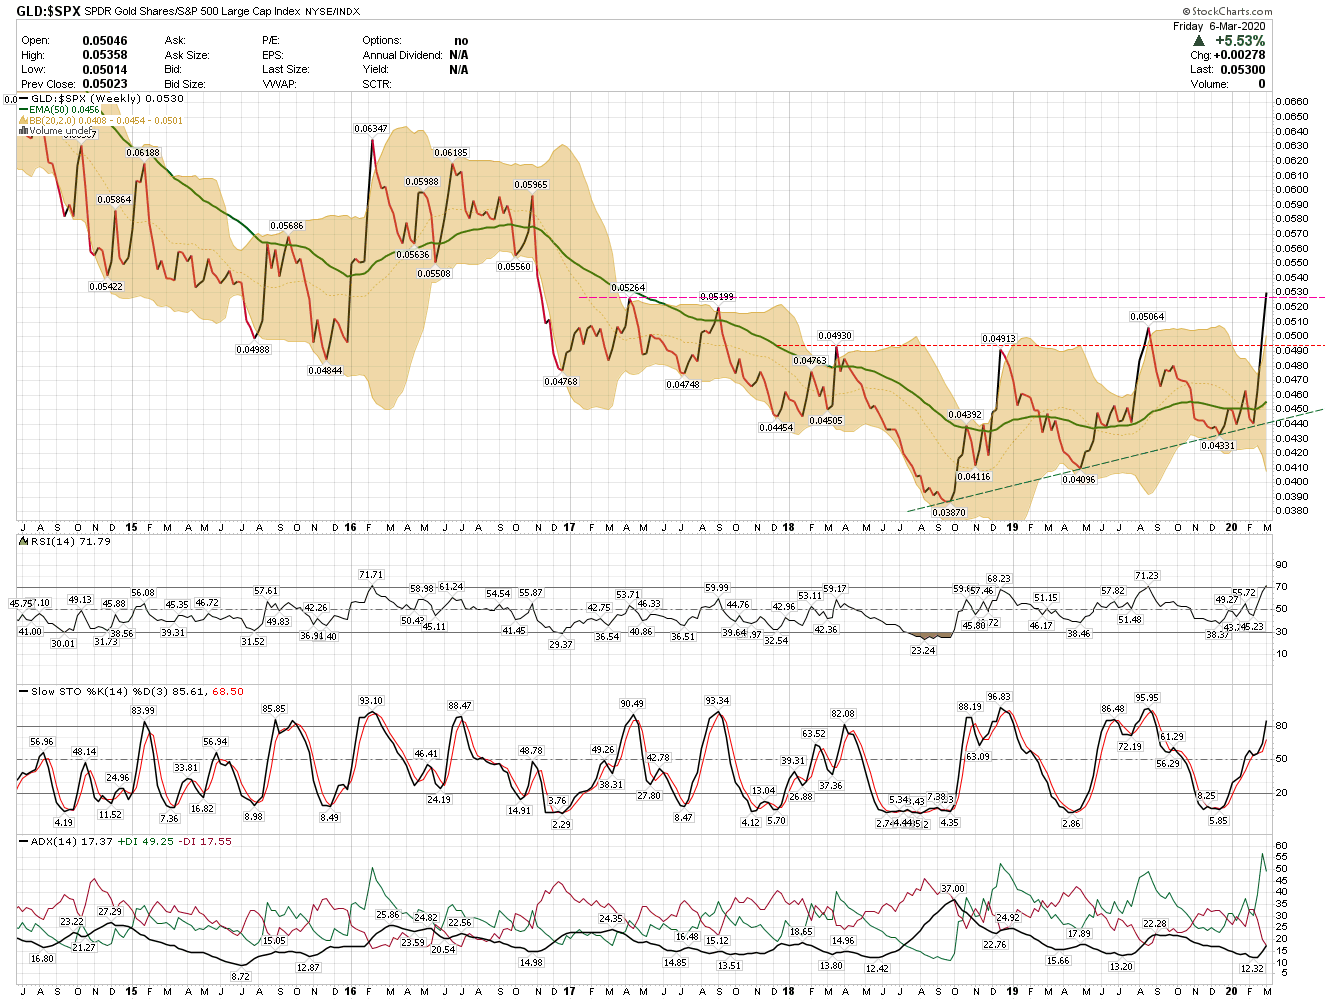
Here’s a look at the Weekly Ratio Chart of the same:
We’re likely in the 5th wave of a 5-Wave move upside and timing could prove problematical here with a “turn” expected in the 28-week cycle of gold (though it could be a low, believe it or not!), so I’m not taking any futures positions tonight. But I’m looking to.
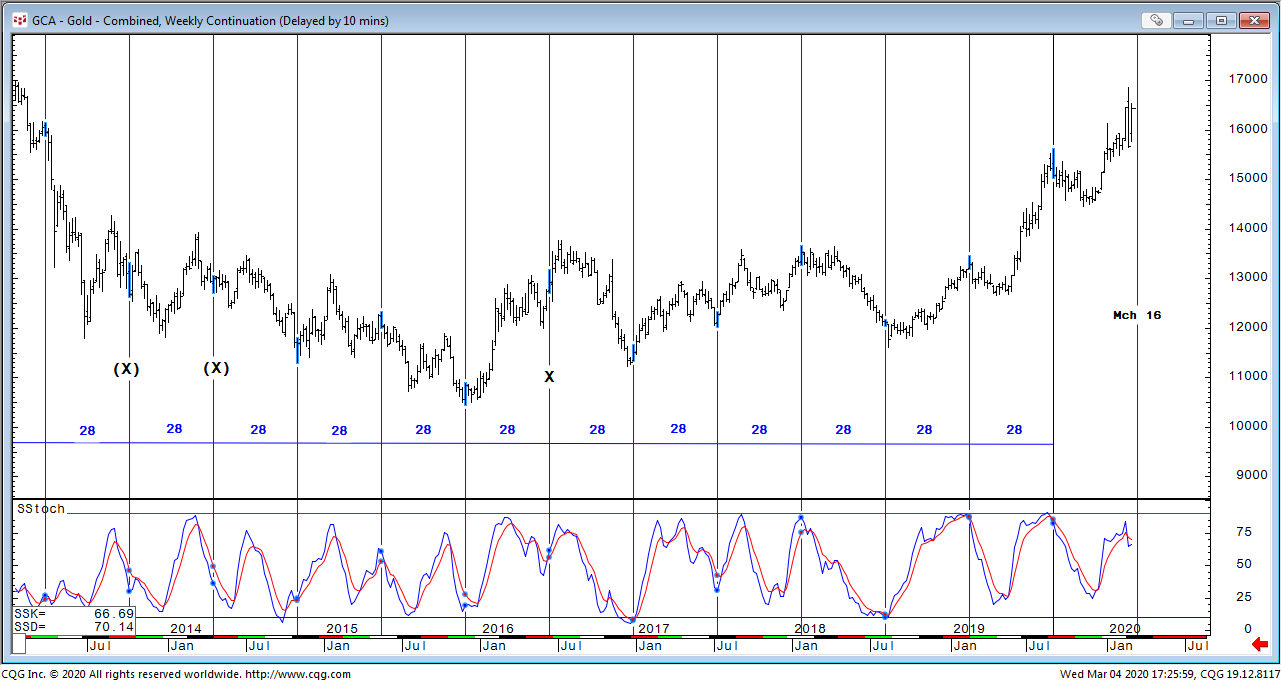
BUT…we could be here, so Gold might not dip much at all, and what could be a high in this “turn” window of 28-weeks could be a LOW as I just said. Things are about to get even more volatile!
Very nice analysis Boobooman. Indeed.. the fed is faster than expected.. since they might of leanrt form 2001 and 2008.. no need for politice to go neg and qe.. Trump has paved the way to make it MAGA.