Gold Monthly, Gold to USD ratio weekly
See not sign of concern so far.
Monthly chart shows bull trend intact. Area covered by aqua is the time RSI stayed below 50 -30 below range. Yellow area from 2000 to 2011 when gold was rising. Once again after breakout from downward leaning wedge gold appears to have resumed uptrend and RSI once agin in above 50 -90 level.
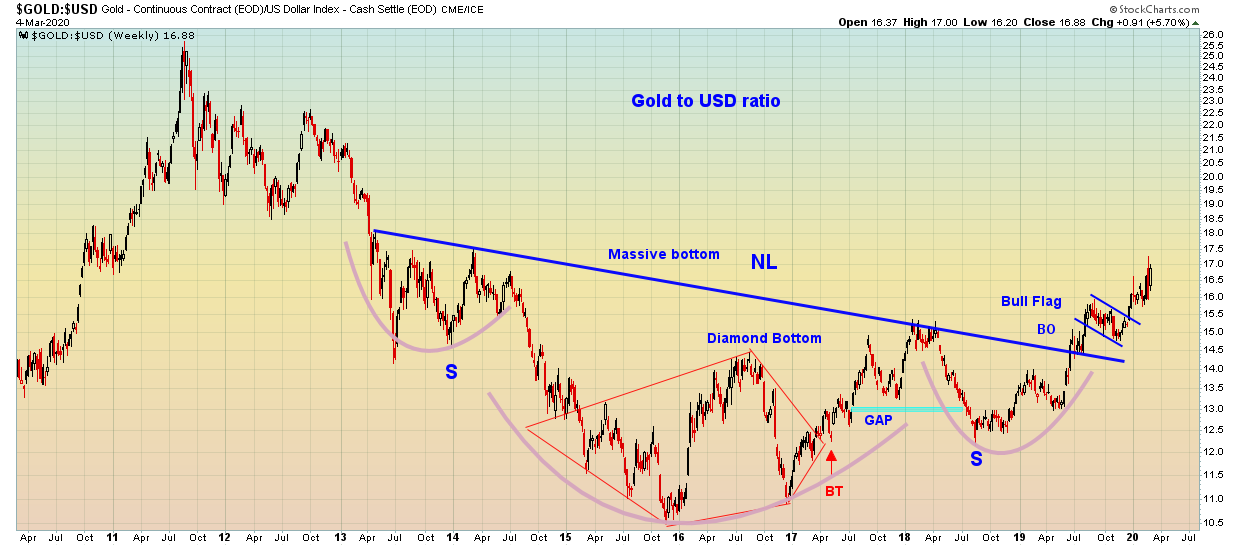
Another chart is gold to USD ratio a clear break out from a inv HnS. it is continuing higher after consolidation. This is same as North chart (daily) but zoomed out further in time.

Great Charts Sir Bikoo.
Thanks to Rambus. Monthly chart is from his archive. Added TA oscillators. Looks good so far.
Good charts, Bikoo.
All good for gold.