25 and 50 years
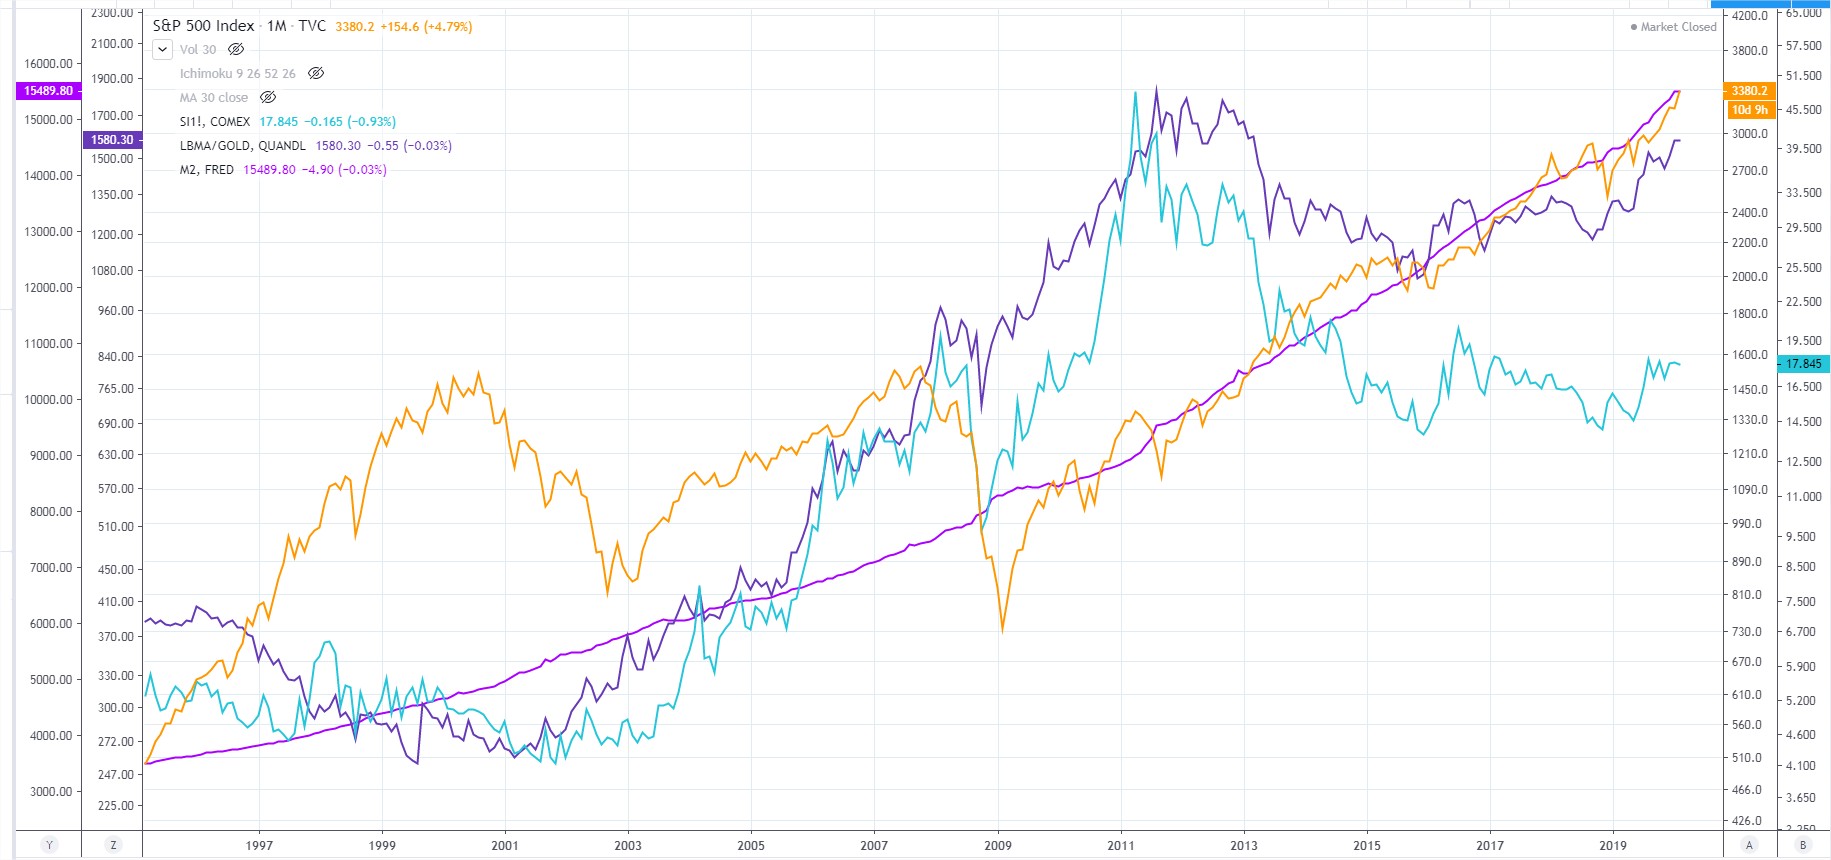
25 years … but analog + M2 money supply
50 years … when you zoom out, all I see is higher lows for all…
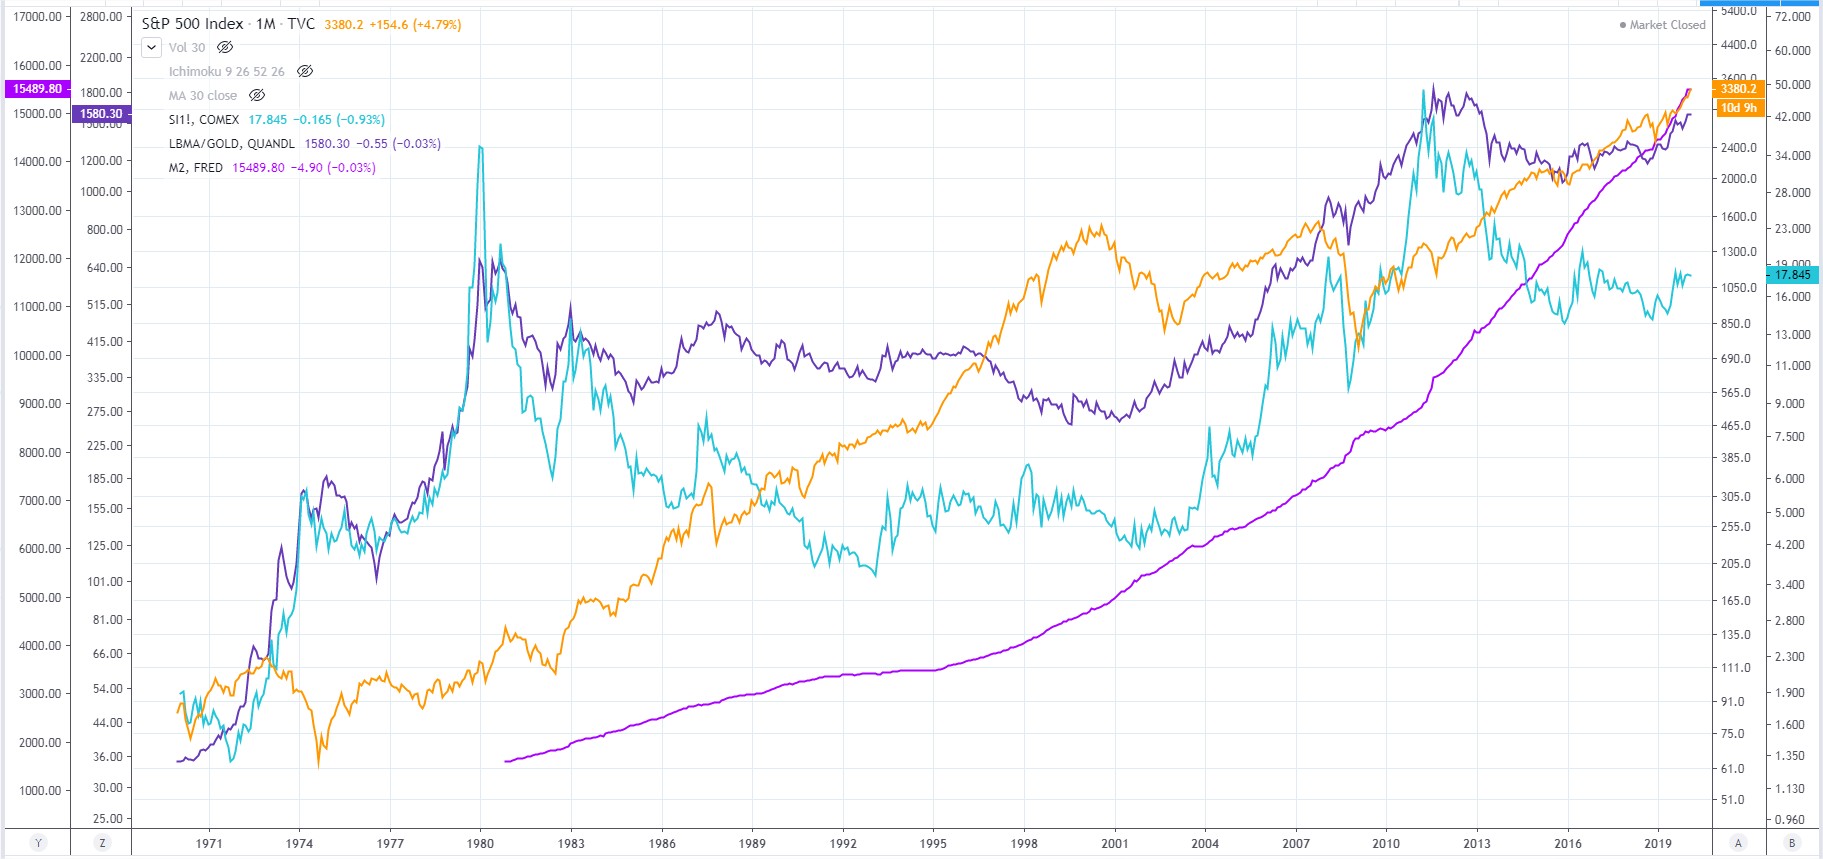
Edit 1: Actually see a “mean reversion” for silver to catch up with money supply… and out perform.
Edit 2: note 25 year chart (linear m2, will do more tests with an analog one).. when gold and silver stretched below it early 2000’s… signalled for a “catchup” to reflect money supply increases.
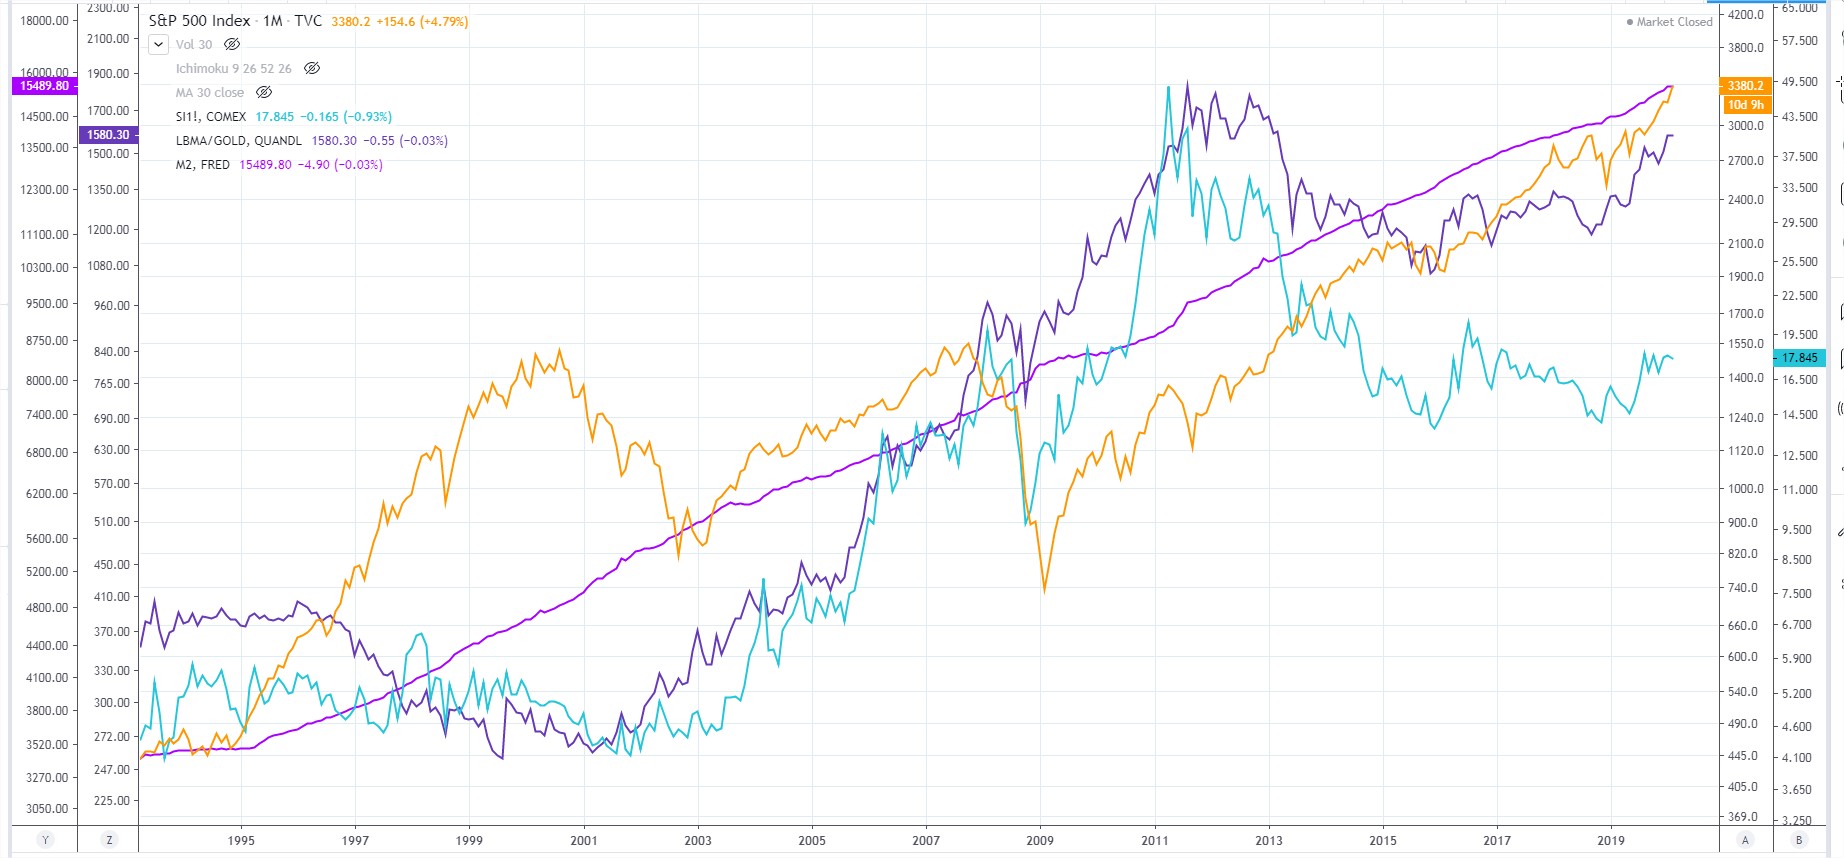
Edit 3: with analog M2 money supply
25 years
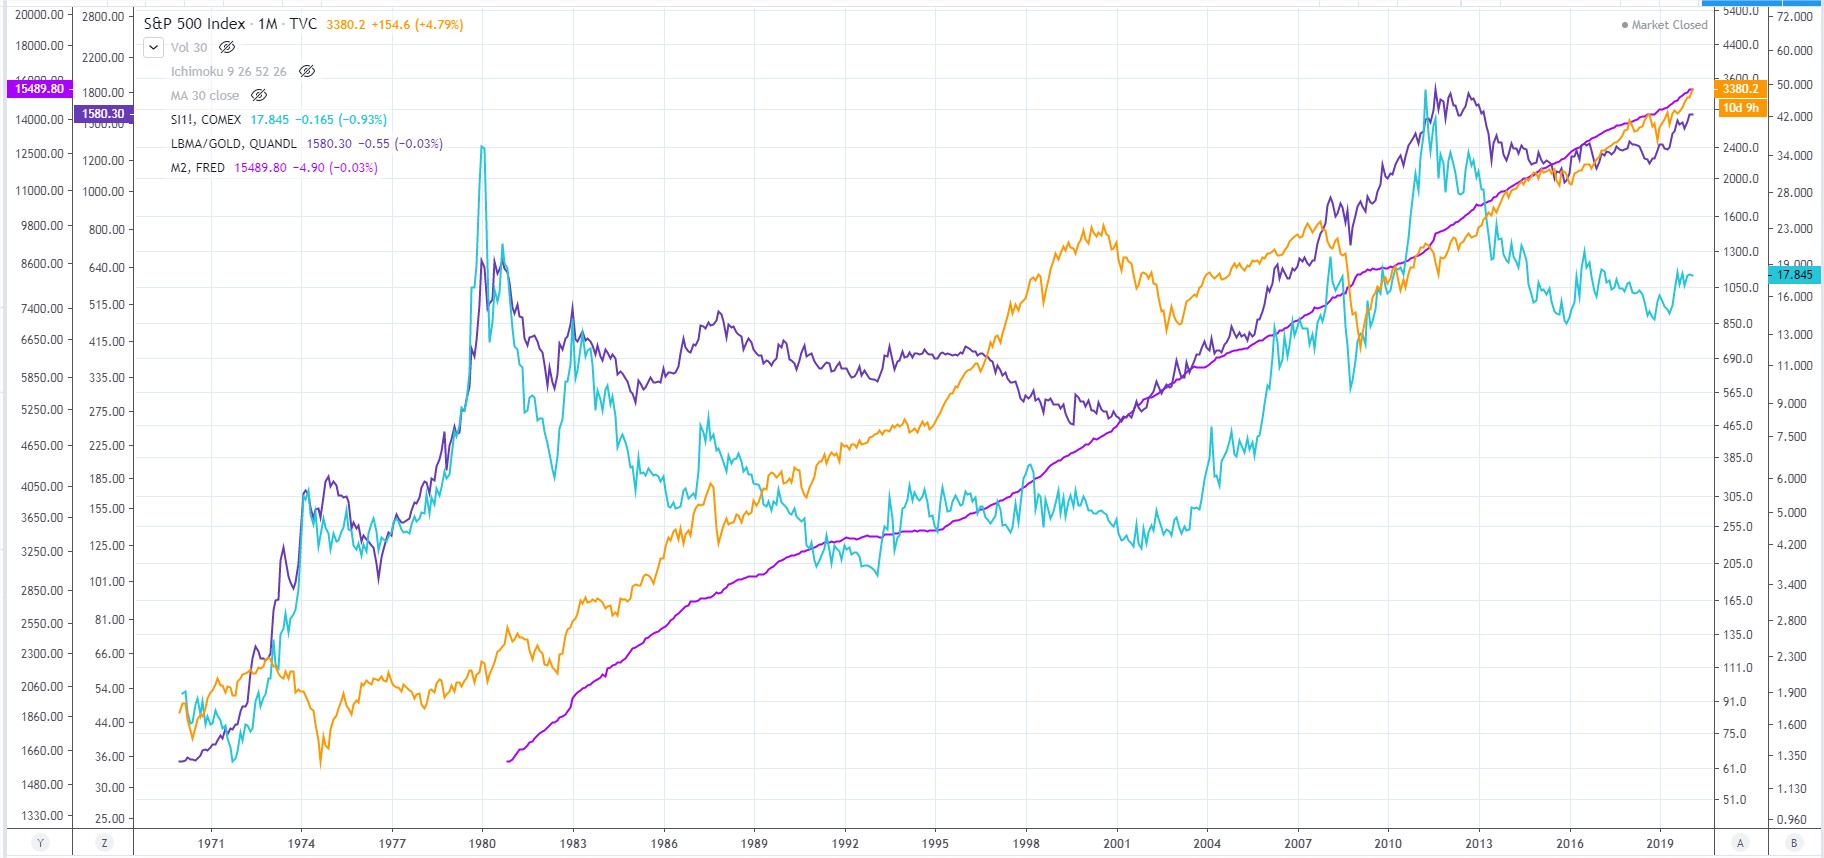
50 years
Signal even more clear silver has catch up to do.
Edit 4: looks like 50$ silver would bring it back “on-par” with rest of field…
Proof That the S&P and Gold are just keeping up with Inflation ( as defined by Money Supply
But Silver is Not !
You say It HAS to catch up .
Why ?
What if would be future silver investors are all going to buy Bitcoin instead
The history of failed investors is filled with those who thought “Their” investment HAD to catch up.
These charts all say
for 10 years Gold good S&P Good…Silver No Good.
I have al LOT of silver so this is not talking my book but it is reality
Because silver is a precious metal and a commodity. Inflation rate will help in both cases.