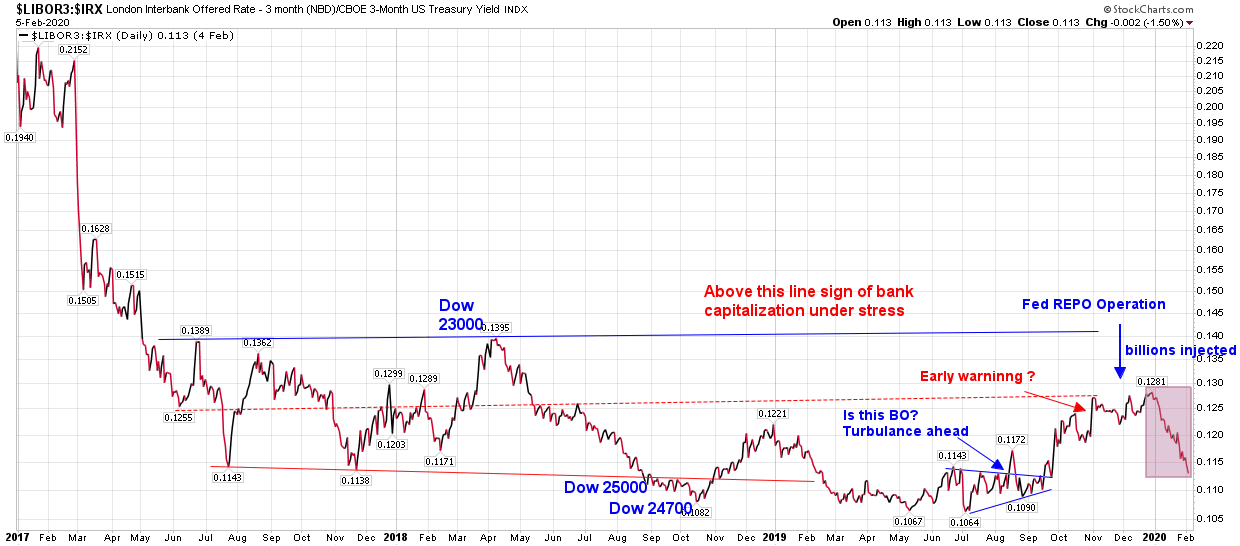
Libo3 vs T Bill Spread
It started when the spread began its climb above threshold. Nov 2019. That is Repo operation to inject liquidity.
Credit tightning in the market represented by GSR vs FED intervention.
Market up up up up way ??
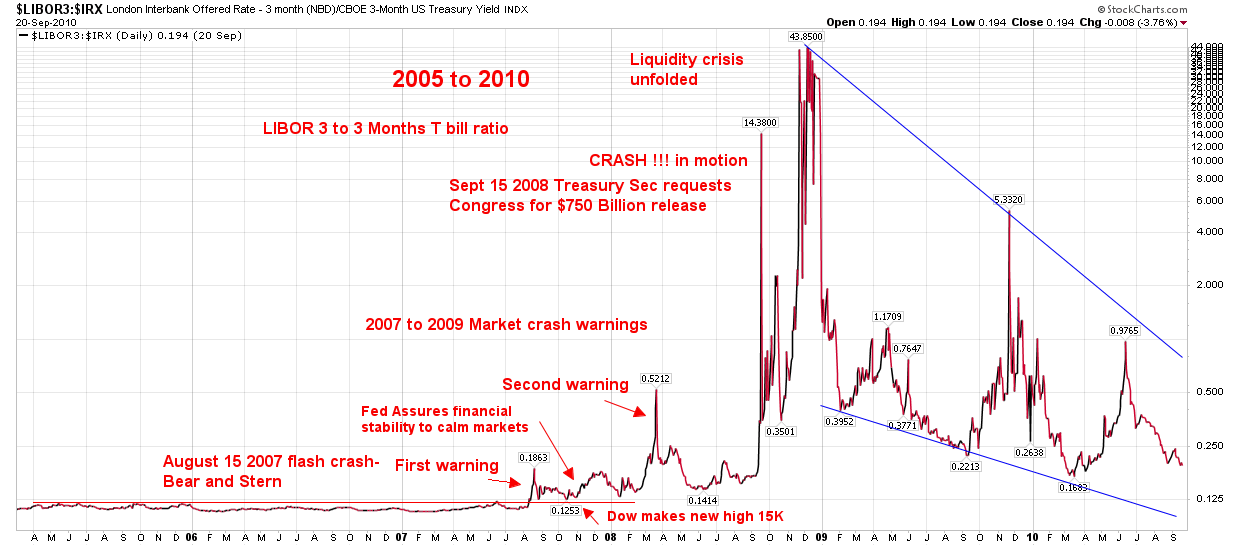
“The short-term interest rate at which banks lend to other banks versus the equivalent interest rate at which the US federal government borrows money, as depicted on the following chart by the LIBOR-UST3M spread.
When trouble begins to brew in parts of the banking system it gets reflected by higher interest rates being charged for short-term inter-bank loans well before it becomes common knowledge. This causes the spread between 3-month LIBOR (the average 3-month interbank lending rate) and the 3-month T-Bill yield to increase. For example, the LIBOR-UST3M spread was languishing at around 0.20% in early-2007, indicating minimal fear within the banking system, but then began to rise steadily and reached 0.75% in June-2007. This was an early warning sign of trouble. The spread then pulled back into July-2007 before rocketing up to 2.25% in August-2007. This constituted a very loud warning. After that the spread became very volatile and moved as high as 4.5% at the peak of the Global Financial Crisis in October-2008.”
Chart by Sven Henrich tweet: “Welcome to 2020:
The Fed in crisis intervention mode creating the loosest financial conditions in history.
Anything goes.
There are no bubbles.”
https://twitter.com/NorthmanTrader/status/1225391547379834881/photo/1
Interesting. Thanks Bikoo.
Repo oversubscribed 1.9x last night. Second time in three days.
My work is NOT telegraphing market demise (in nominal terms) anytime soon.
Doesn’t mean the real economy isn’t struggling though.
Simply means central banks won’t quit hammering when all they recognize are nails.