Looking across the bridge
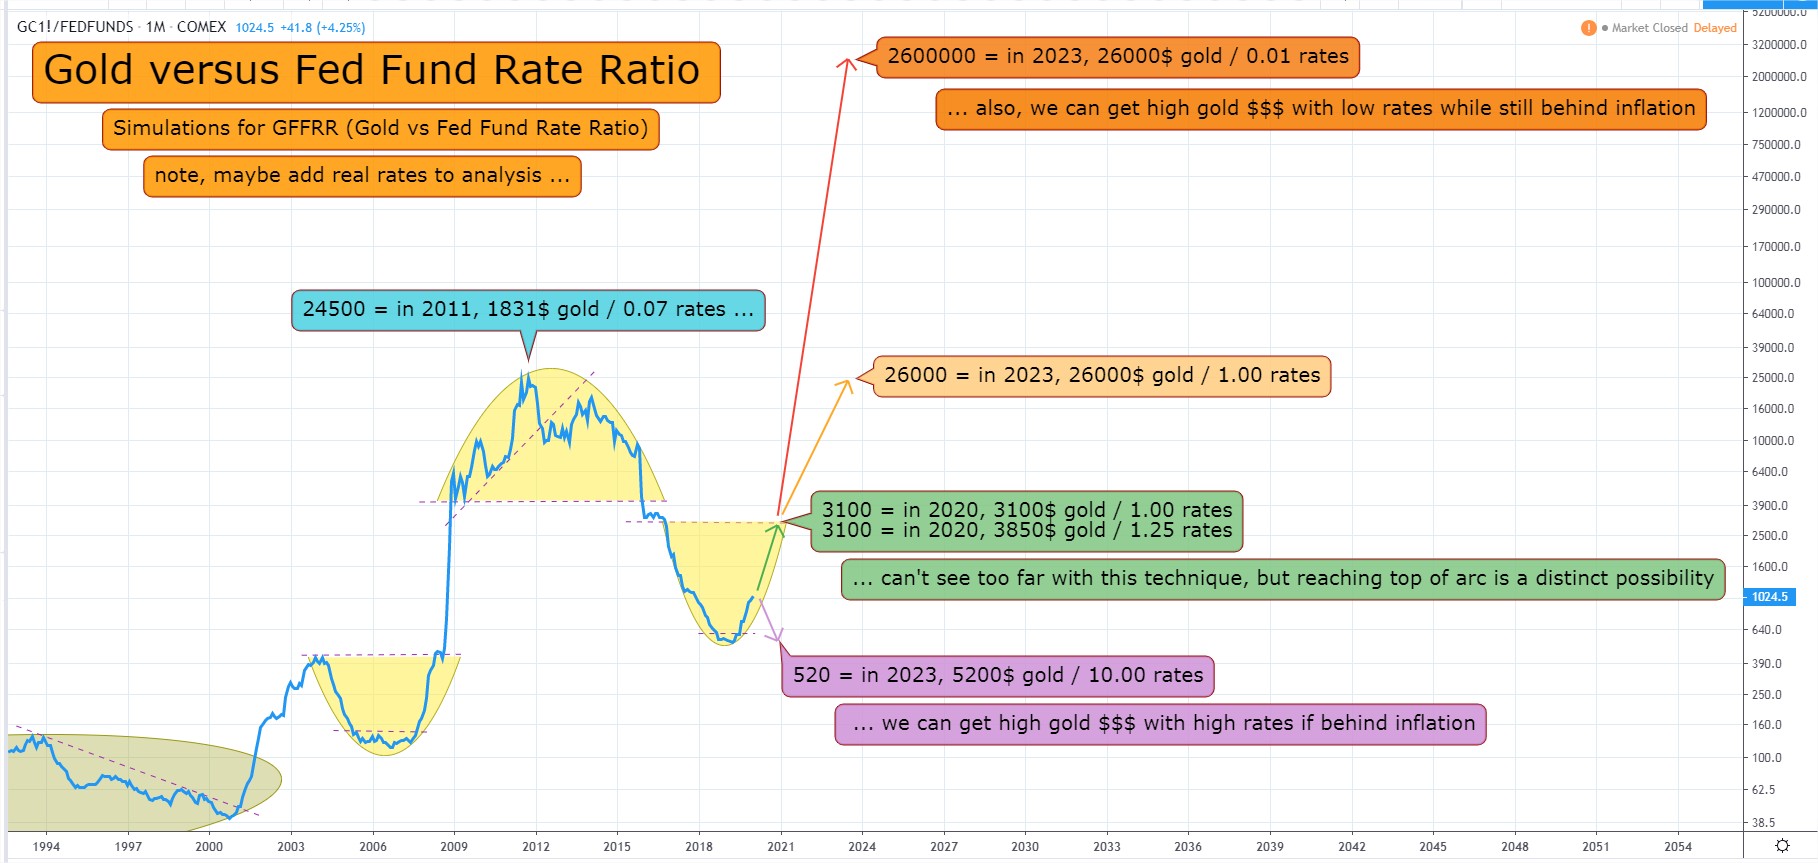
Rehashing a rabbit hole I was digging in late December… the gold to fed fund rate ratio! Added some arcs and a classic measured move target …
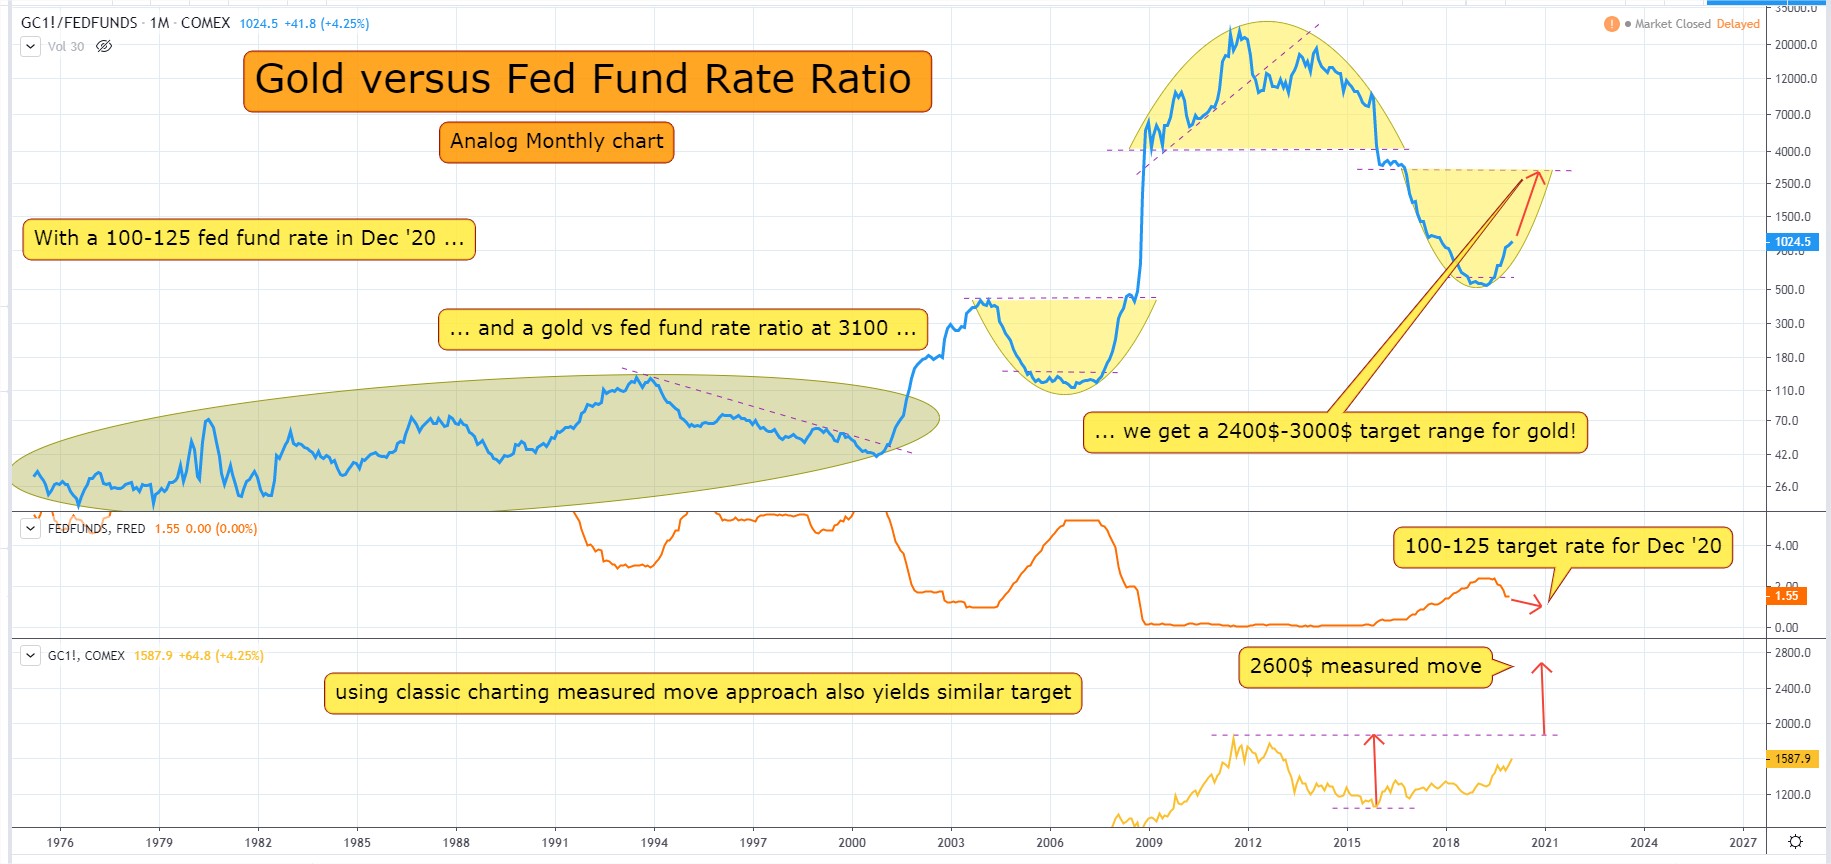
Still on track to get those two cuts by end of year…
The timeless price cycle analysis also has those numbers as possible cycle highs …

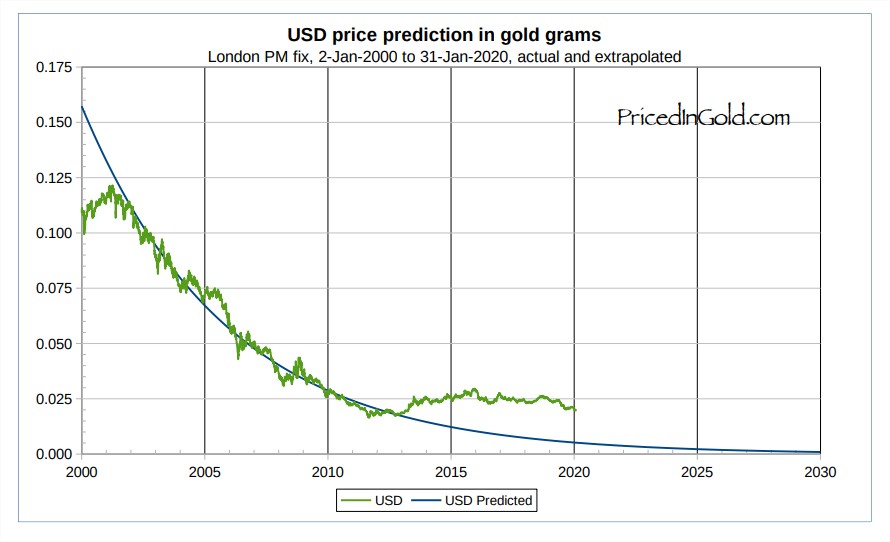
Bonus chart.. what if the US dollar resumes it’s half-life decay curve … me thinks we over shoot that 3k and go straight to jail!
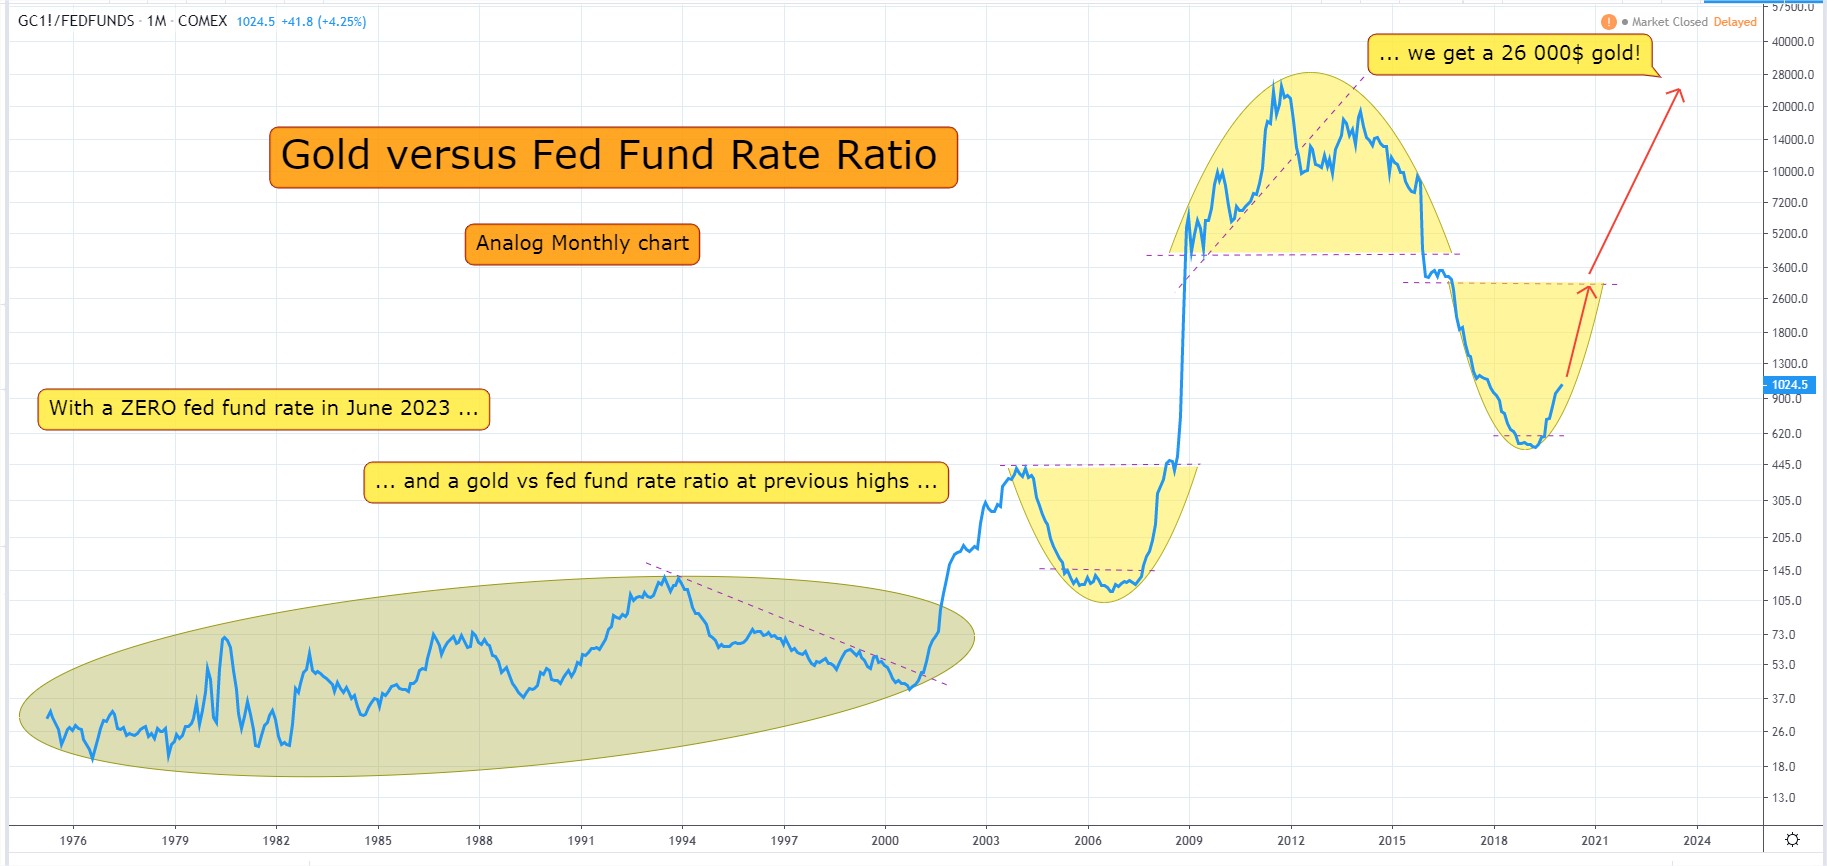
Could end up at 26000 gold in June 2023!
Edit: nope that seems all wrong… I’m going on a coffee break now.
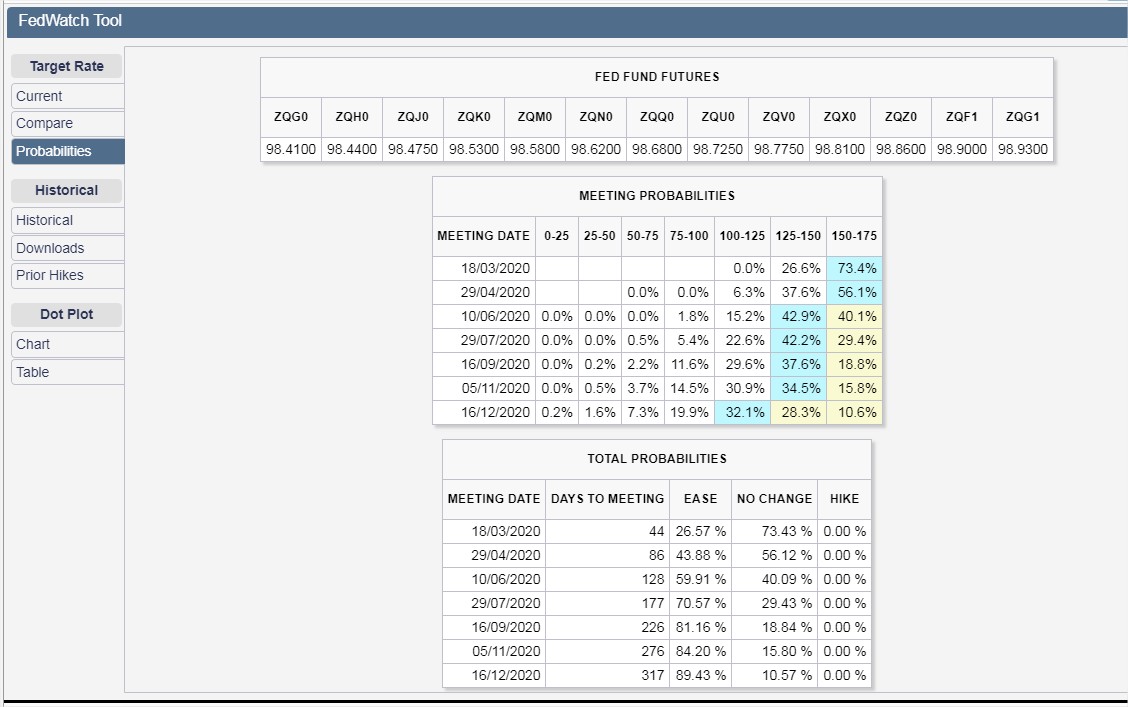
Edit: adding chart with gold to rates simulations… can’t see too far with it… will try to do with real rates next… might have more meaning
Anything above $2000 will keep me happy.
yeah.. and see the actual chart for gold.. what it will look like.. and the rest of the precious metals complex. I’m in practice mode.. before game time… making a bunch of mistakes along the way. soo many variables…