Gold – The Big Move Of 2020
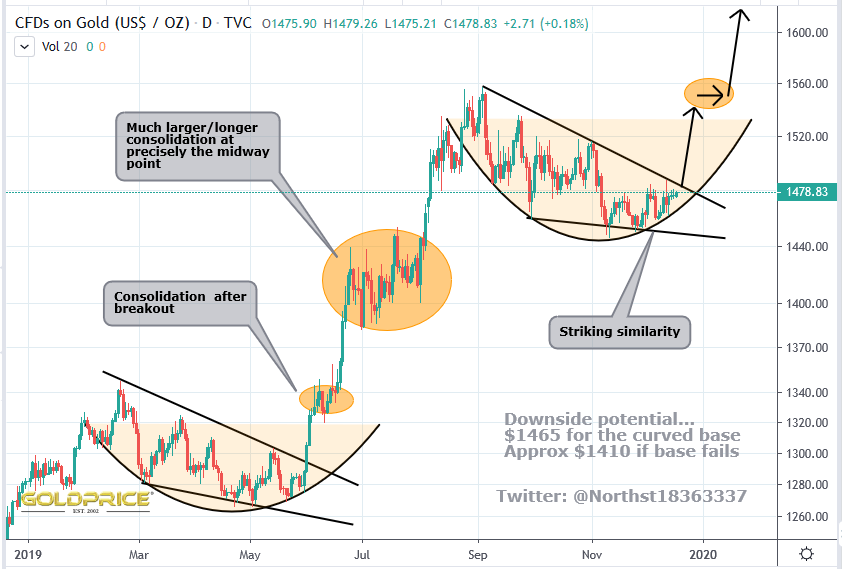
Here are 3 charts which summarise how we’re progressing. First up, here’s the one I posted on 18th December, when I identified the most likely pattern and resulting move that would result…
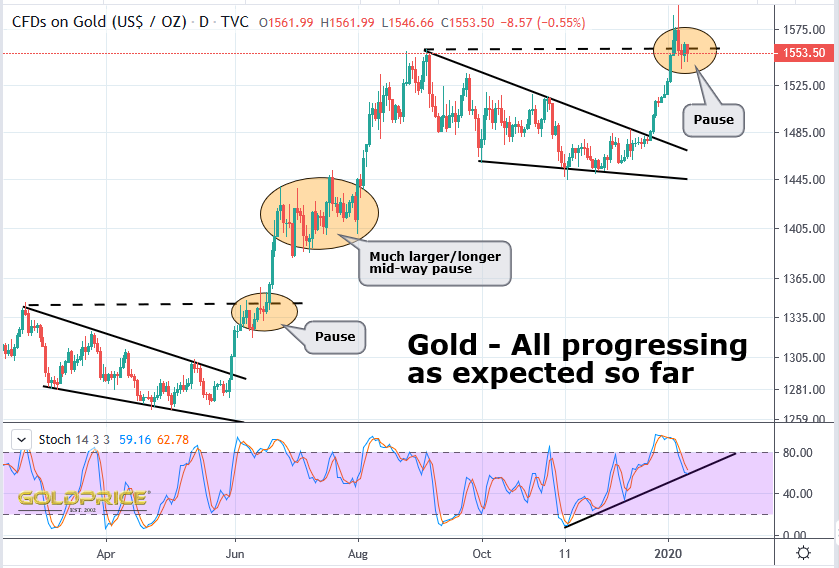
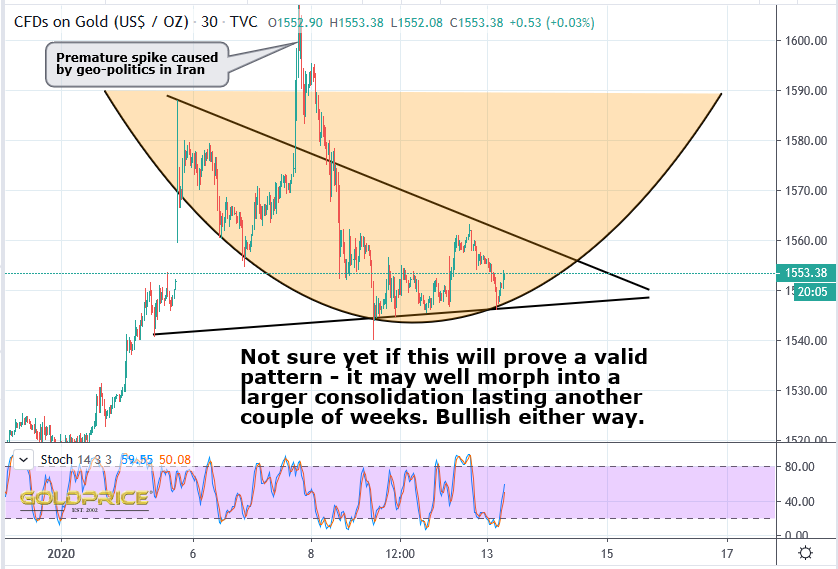
Next we can see, what happened next, along with a chart which is a little more zoomed in on the area which is marked ‘pause’…
Thanks for the charts, Northstar.
Pretty sweet. We should all aim for high probability technical analysis, adapting tools to best fit instrument behavior… and not necessairly what we are used to, forcing it on a chart.
Well done NS!
These jigsaw puzzles are tricky, but satisfying when you start to see the picture coming together.