Different views on the CRB
Nice discussion going on with this commodity index. When I see a chart.. some instincts I have is to see it’s long term correlations to instruments I’m looking at.. Correlations change… often subtly.. but our reflexes are to resort to old adages. Always good to refresh one’s view.
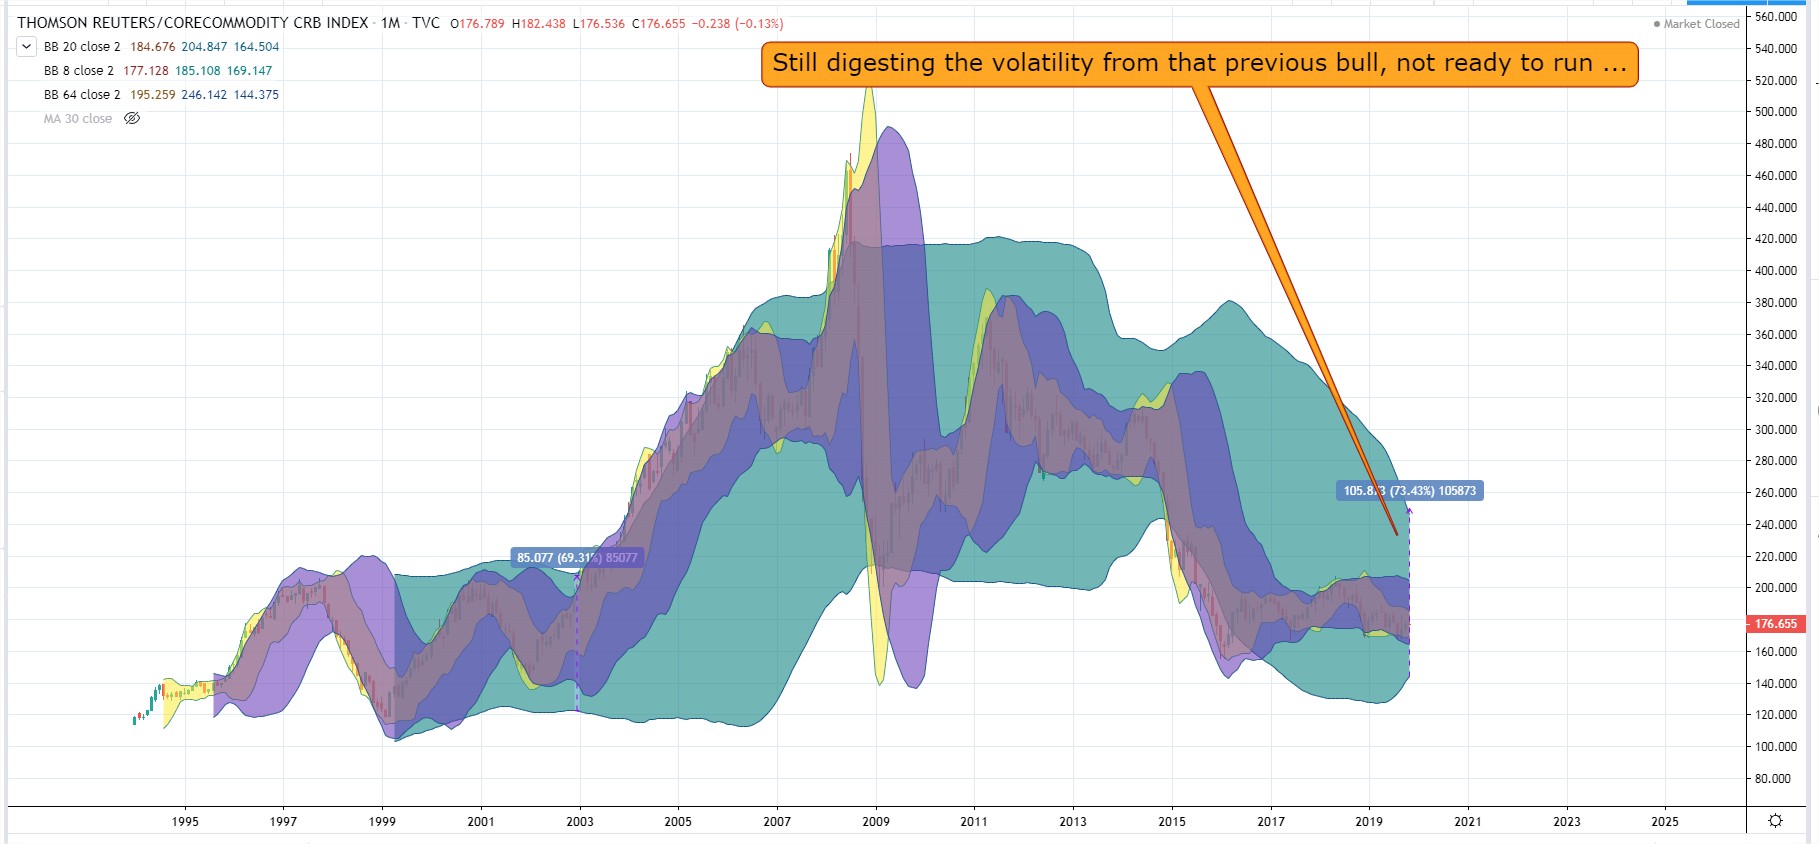
This first chart is CRB with my Bollinger Band Madness (wish I had a longer data period)! The flood gates don’t seem on point yet to signify a “multi year” sustained bull run for this instrument.
Next is to see how this can lead, and give me consumable insight on the precious metals.
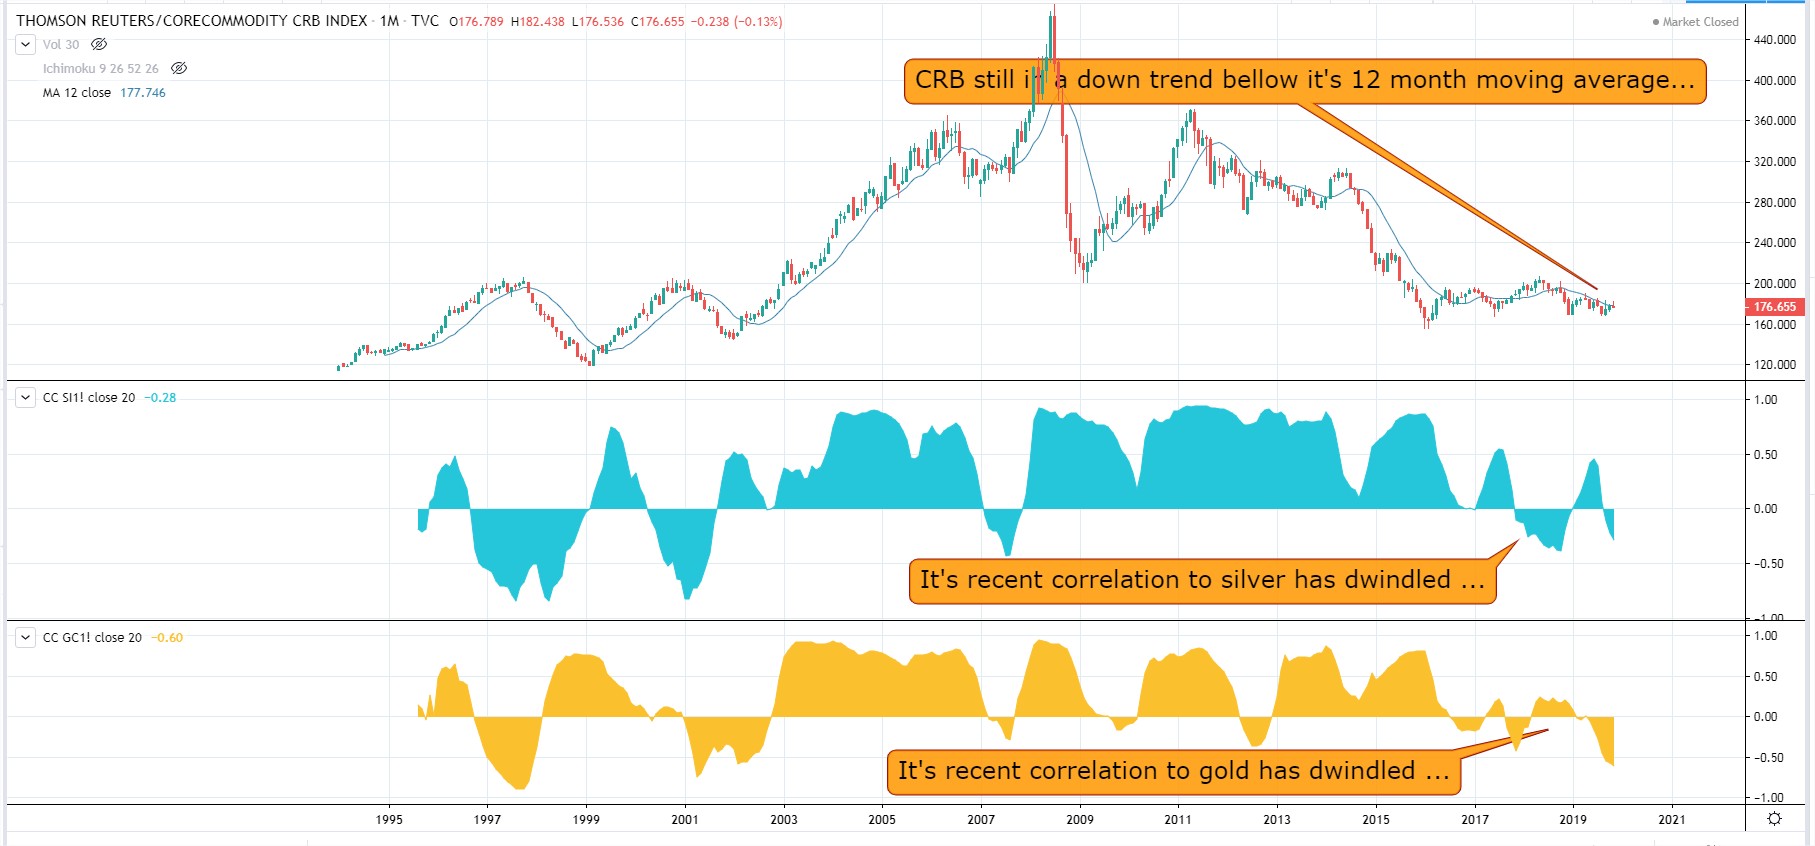
So clearly, until the CRB goes back above it’s 12 month moving average, and remains there long enough to have start skewing upwards… it’s has downward trend.
However, it’s direct implications on the price of gold and silver are not once what they were.
I can’t remember the name of this actual theory (some thing I read from Peter Brandt) , that the true macro market movers are sometimes only understood once they have actually played out… and then hind sight kicks in… until then.. we are using our spy goggles and being true Sherlock Holmes detectives…
Ahh… so much fun!
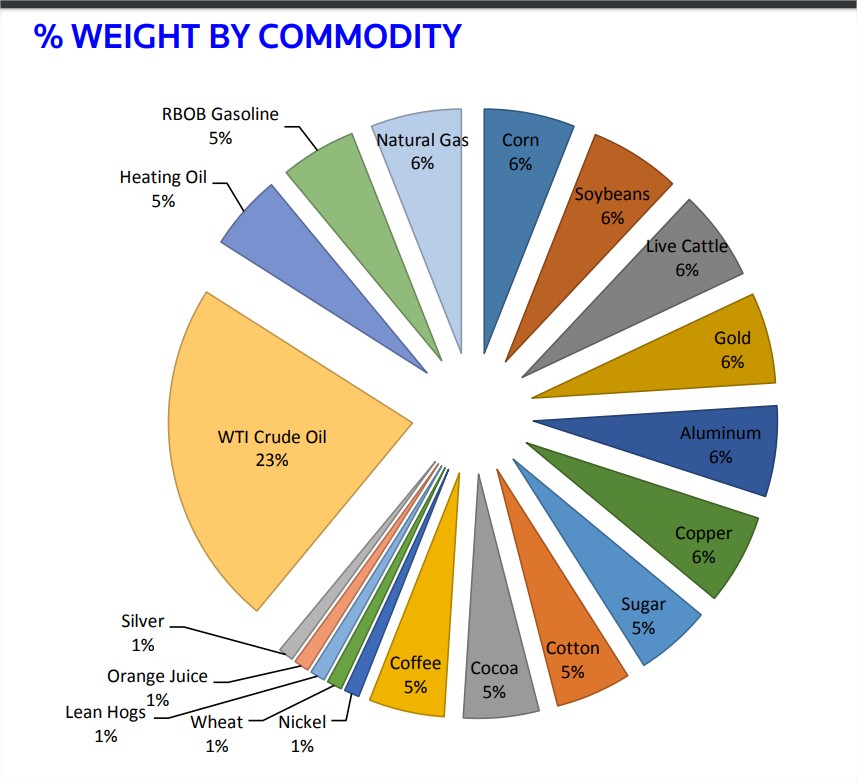
Edit: To better understand what the CRB is… adding CRB compositon. Inception date was 1994, so it explains why I don’t have data before.
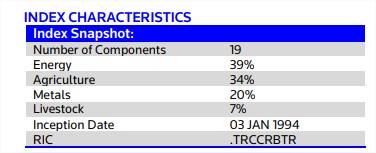
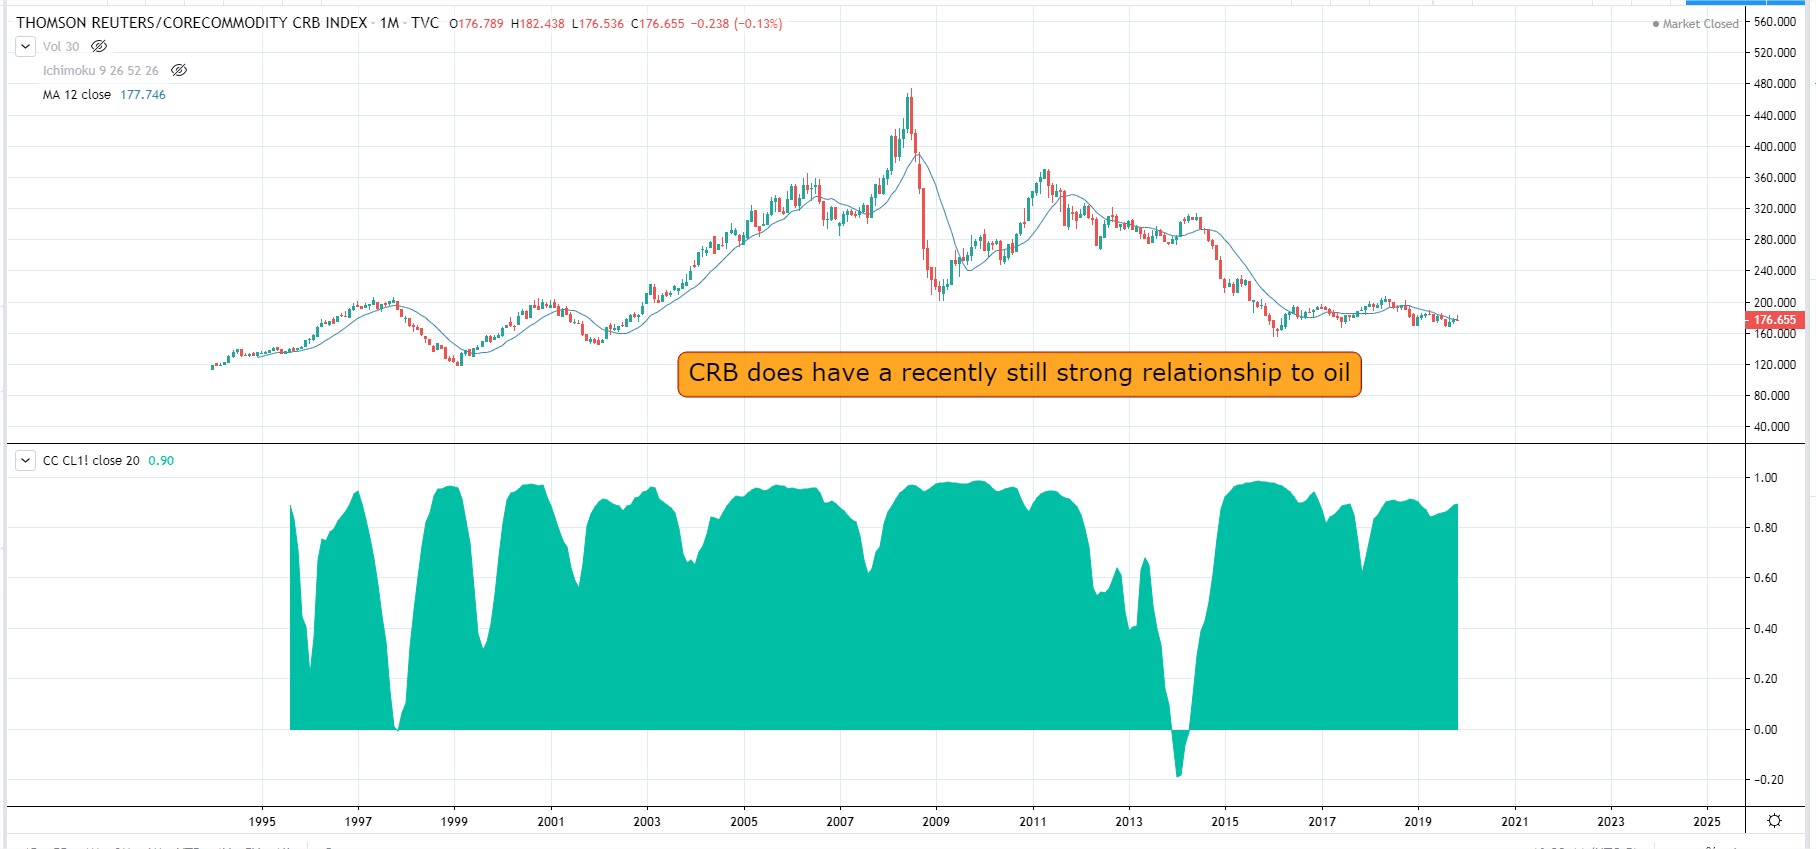
and now look at it’s correlation to crude oil … were energy is 39% of it’s composition, while metals are only 20%
Silver is only 1% of it’s composition while gold is 6%
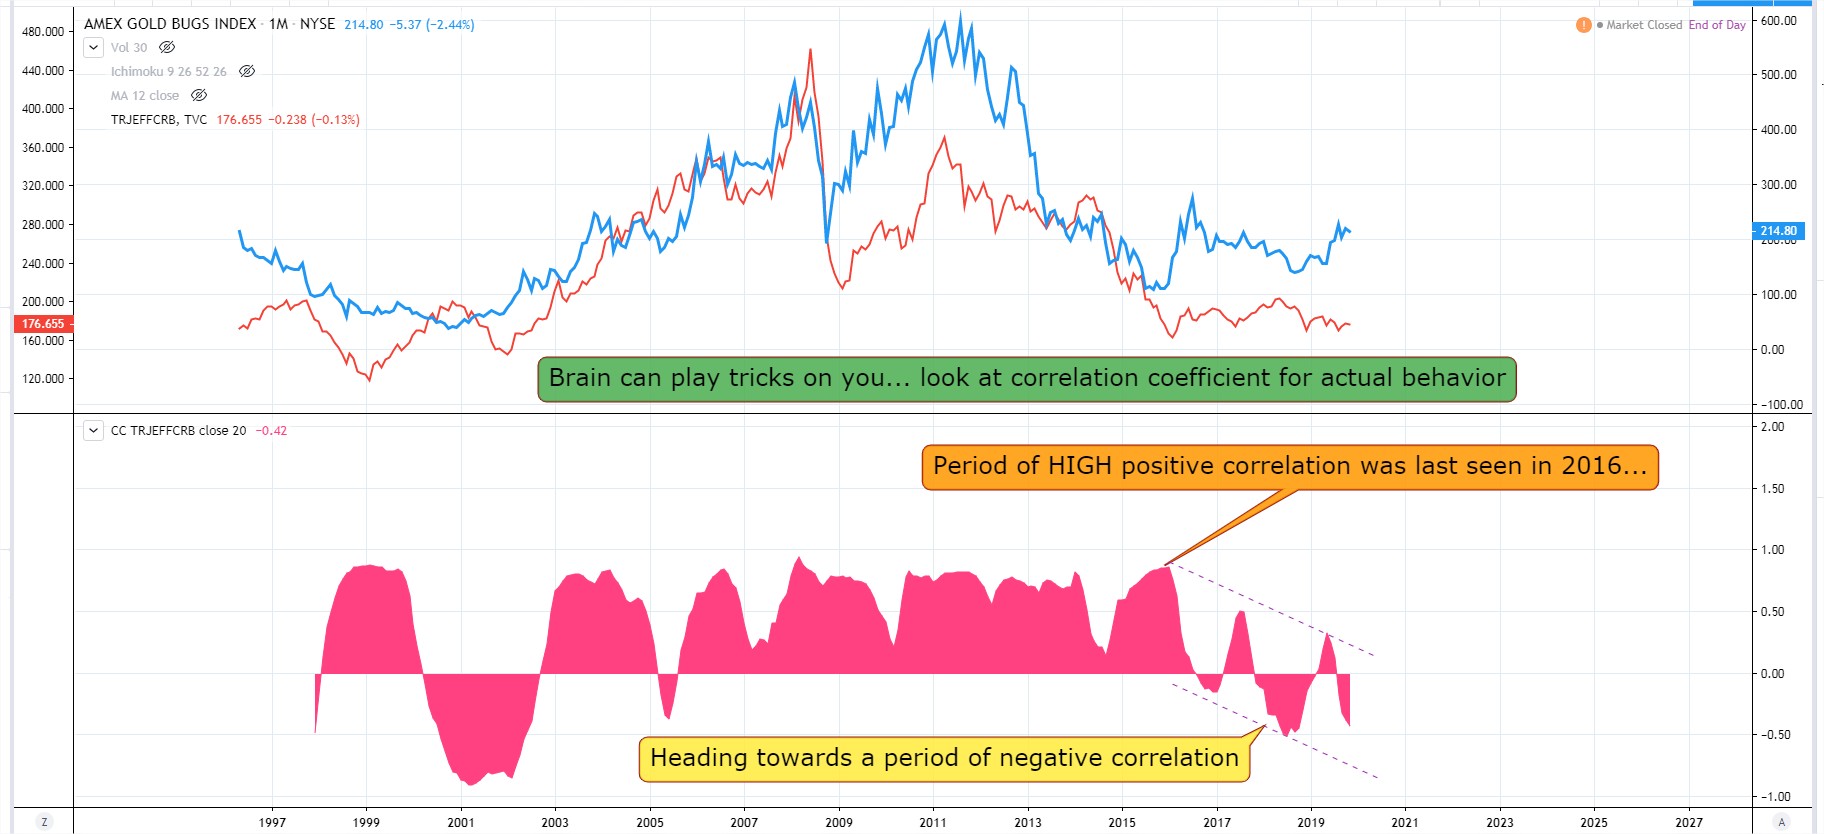
Edit 2: Added for Red Label the HUI on top of CRB + correlation coefficient..
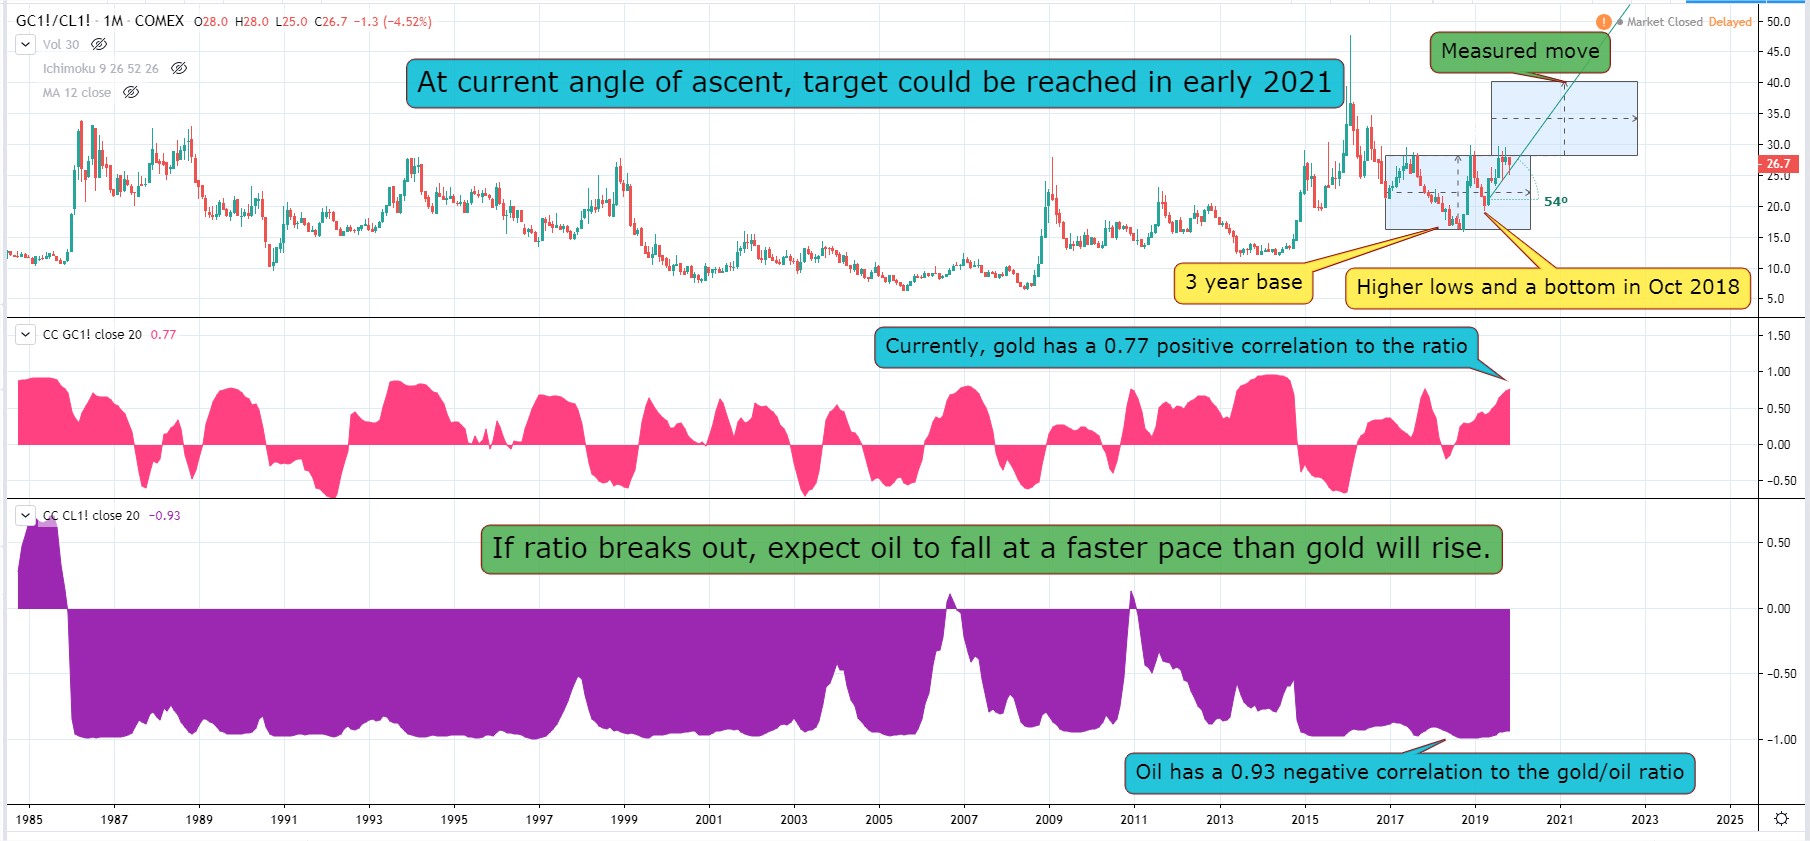
Edit 3: Added gold to crude oil ratio.
I still need to deep dive this alot more… my first reflex is to classify silver and gold as commodites AND precious metals.. with silver being somewhere in between both (less of a precious metal than gold.. but more of a commodity than gold).
Overlay the HUI on top of the CRB
Hey Red, I added a chart.
The point being; Is the HUI not at responding to recent action in gold because the PM miners aren’t getting value from secondary mined metals such as Cu Ag Pb Zn Pt etc… because of deflationary forces of the CRB? As seen in the GSR………..
Those secondary metals are still a VERY small portion of the CRB basket. If 6% is for gold.. 14% left for all other represented metals (6% cooper and 6% aluminum, 1% nickel and 1% silver). CRB is showing mostly deflationary issues with energy and agriculture. The miners have ALWAYS lagged by many months the underlying metals break out.
Note, I’m a slow learner.. and could still be missing your point. If so, I’m sorry in advance!
Can commodities rally in a environment of a strong $US? IMO Gold has rallied recently with a rising $US due to financial stress yet the the CRB has weighed down the HUI.
There isn’t a whole lot of data other than maybe Newmont or Freeport of how PM miners or Copper miners react as the DXY approaches 100 and continues to rise, the reaction of the reverse should also be duly noted as the $US declines thru 100.
IMO it may be why some Gold bugs follow Sugar price fwiw?
Your comment about brain playing tricks is most apt. Looking at correlation coefficient is a really good thing.
It would be interesting to know — but essentially impossible for any of us to find out — approximately which raw materials constitute the typical expenses of gold mining overall, and to what extent. I think we are often given the impression that oil and perhaps electricity are important, but obviously many other commodities directly or indirectly go into producing (metals in trucks and other equipment for example).
I wonder whether the propeller heads at some big hedge funds or other major financial institutions have a good idea, and whether they have their own mining-cost commodity index and then chart Au vs said commodity index — either in general or for particular companies.
To be more complex, they might add to their model of mining costs things like interest rates since mining companies often have loans. They might then chart Au (or whatever mix of Au and other metals are produced) versus this cost index.
I’m just letting my mind meander as usual.
However if it’s true that energy costs are typically huge for mining operations, Au vs oil might be at least as applicable as Au vs CRB. But both interesting.
Karl, so your are making think that CRB is actually a hurt to the gold/silver miners, as they heavily represent costs for the mining production… Very thought provoking. This would be the premise for the gold/oil or gold/crb looking to break out on the monthly chart in favor of gold or silver. Gold and Silver go up… while their costs of production goes down, upping the margin profits for the miners.
I do not know. I have not studied the topic rigorously.
My suspicion is that sometimes the gold price is correlated positively with this or that commodity index, sometimes negatively, sometimes not very much at all. The mining companies’ stock prices are positively correlated in general, not perfectly, with gold price, but the costs detract from profitability.
On top of that there are all sorts of irrationalities, fads, temporary anomalies, and so forth. People — or for all I know algorithms — may buy gold in some epochs because of “deflation” or because of “inflation” or because everyone else is buying it and not because of either “inflation” or “deflation”. In epochs where gold prices are shooting up, people may buy gold stocks without paying attention to companies’ profitability is my guess. In some epochs — I’d guess ones where there seems to be relative stability in pricing esp of gold — gold mining company prices might tend to strongly correlate positively with potential profitability and thus probably with whatever they produce (gold and other metals) and negatively with what they consume (probably energy).
So in summary, I have no idea, being an amateur, but I’d bet the relationship is complicated and varies with time.
Well described.I instinctively agree with you.