It’s a probability game
I had these crazy ideas last night… was there a link between gold prices and actual rate cuts? Further more, could I get ahead of the curve and see actual gold price movement while the probabilities of those potential rates were being digested by the market? Lastly, what if I could chart the “rate cut” probabilities and apply TA to them?
Well, thanks to cmegroup, they did the hard work for me! https://www.cmegroup.com/trading/interest-rates/countdown-to-fomc.html
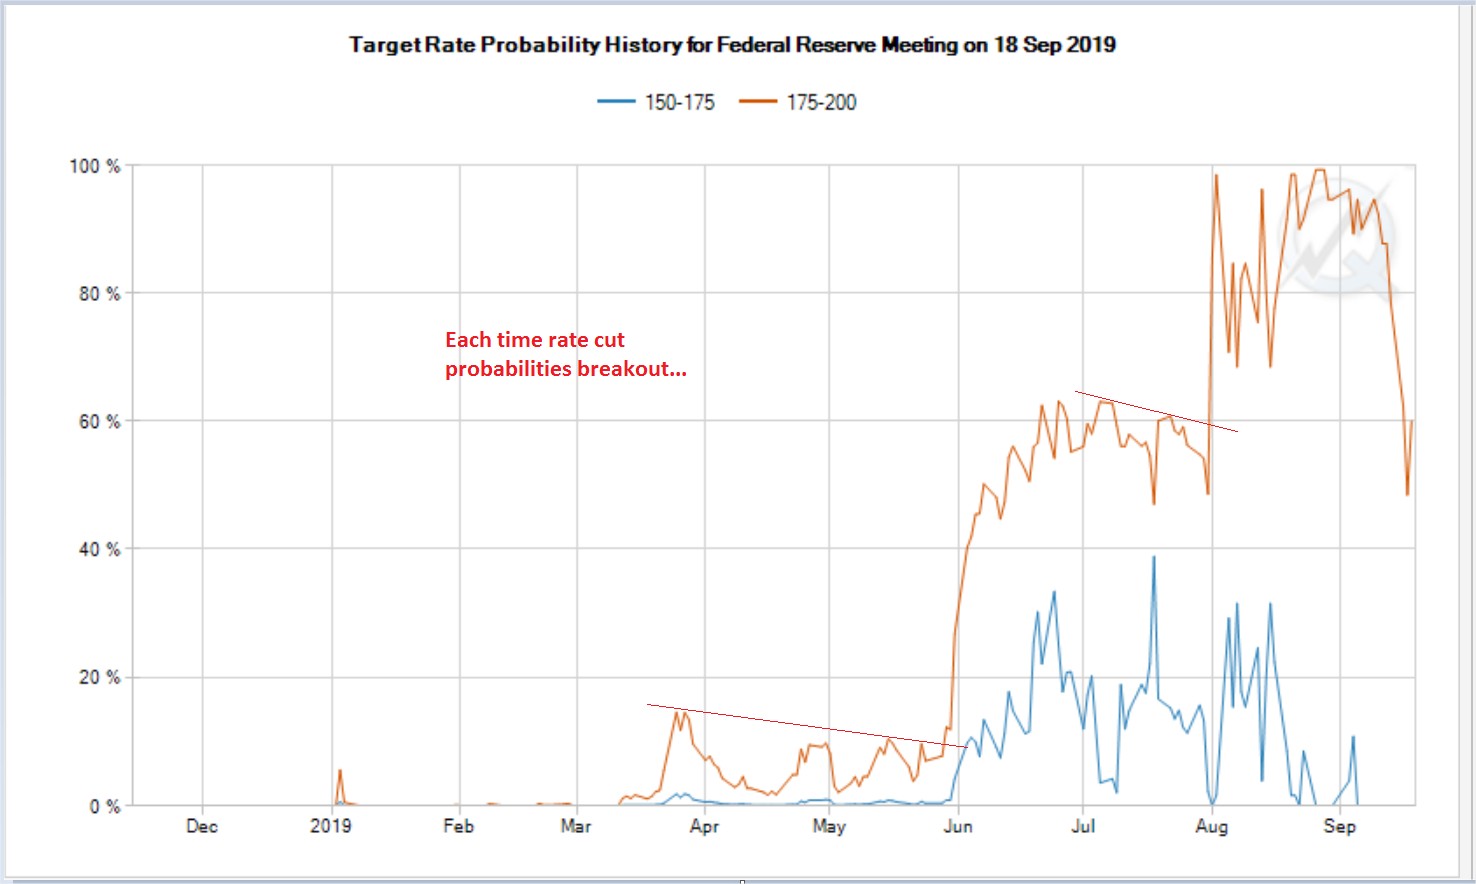
Here is the graph for rate cut probabilities back for the Sep 18th FOMC meeting…
Now here is the gold chart…
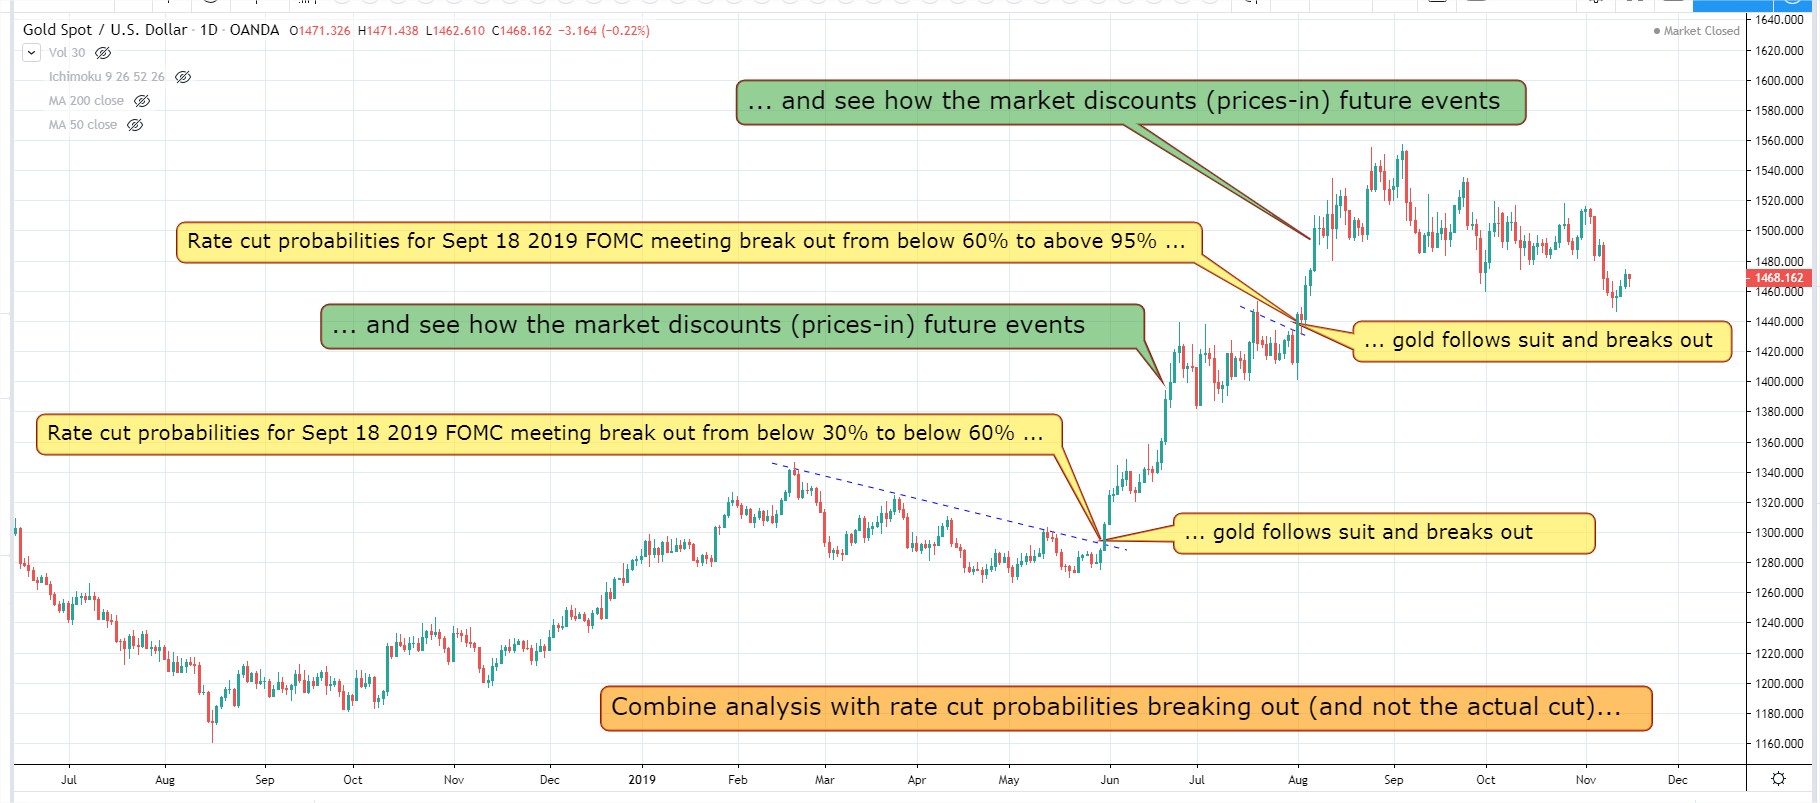
So, this is typical “buy the rumour… sell the news” type scenario. But now, you get proof via a cool looking chart! Helps crystallize that idea.
Don’t wait for the actual cut to play gold… but when their probabilities actually “break out”!
Edit: Adding some more scenarios…

Patrick, Is your current interpretation of the Target Rate Probability chart on the CME-tools site — Bearish for gold, because of a breakout for NO rate-cut expectations for December?
https://cmegroup-tools.quikstrike.net/ChartImages/BANTIXWFENLB02/QPWUFWHC_000004.png?7526fcf7-3411-4c01-b67e-267bb0233814
It WAS bearish. Damage is already done (priced in) via that sideways/down drift. Everything is now priced in, except the next rate cut, because it’s probabilities of happening have not broken out yet. The bullish part is going forward from here. Unless a surprise rate hike, we are now loaded with 7 more potential 25 basis point cut, and even more if we go negative!!! Question now is how much more time we drift sideways/down? My guess is until rate cut expectations start rising again! 13% chance in late Jan and 25% chance in mid March. Soo I’m guessing maybe 1 month of more patience.
Remember, we don’t need the actual cut for price of gold to move, actually it will not unless the expectations for the next cut are already breaking out. Now, because of December zero expectations. We have paused.
Those 7 cuts could equate to 50% or more rise… brining gold to +2150… #daydreaming
I guess rate cut probability and gold mouvment could BOTH reacting to another hidden catalyst…