Bollinger Band Mayhem
Patrick inspired by your work;
Fully I think you came up with “Too Far Too Fast”
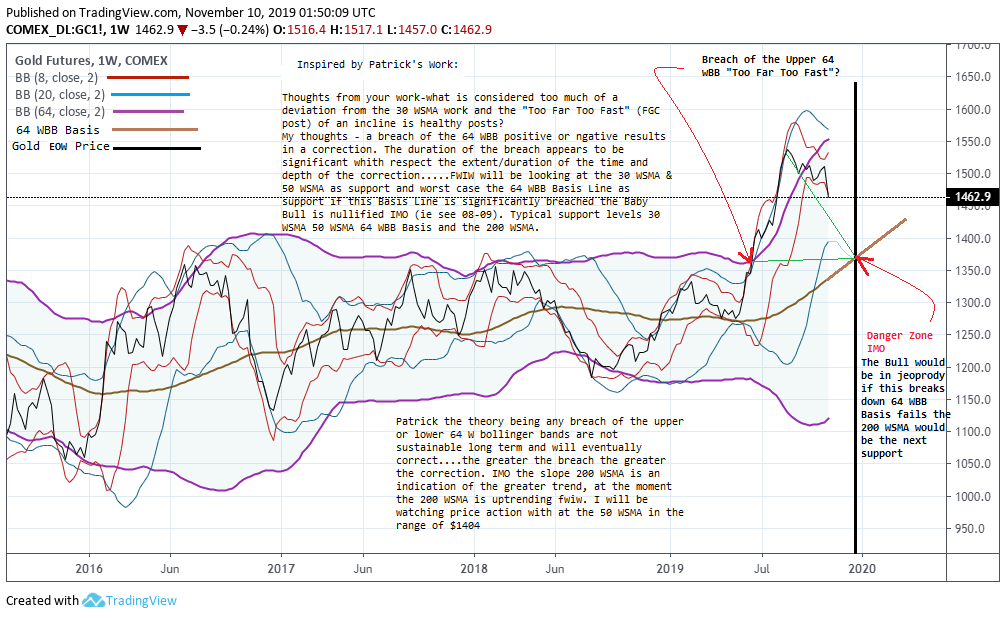
In one of your podcasts Patrick you mentioned price deviation from the 30 WSMA as important as well as the rate of incline of price in Bull Markets. The wheels started turning…..Could this be charted using Bollinger Bands and what is “Too Far Too Fast” (FGC)?
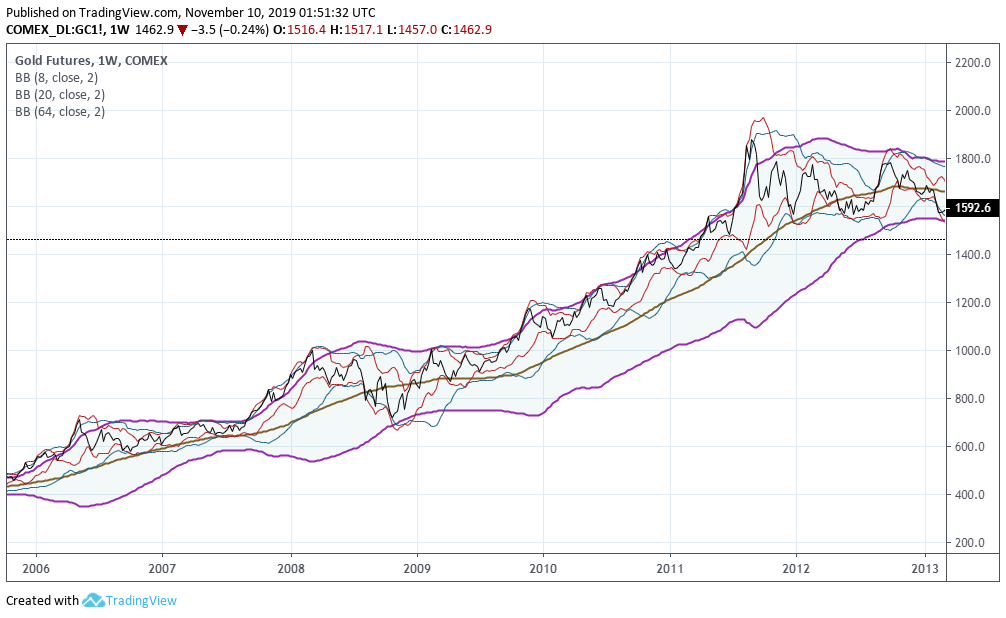
I’m back testing this at the moment but here is some background 8 WBB 20 WBB 64 WBB. I’m also back testing “Price Action” the above BB’s against 30 50 and 200 WSMA. From my limited testing the 50 WSMA is as important as the 30 WSMA. The 64 WBB Basis is also critical and the 200 WSMA slope determines Bull or Bear Markets IMO? For simplicity of the charts no SMA’s were plotted but IMO the 50 WSMA is going to be an interesting level between now and EoY……Buckle Up Kids.
Wow Sir Red Label
This is a unique and ambitious study.
Taking my time digesting it.
Always appreciate a collaborative Effort here at the TA Tent.
will watch this work as the correction plays out.
cheers
Fully
PS I haven’t followed your thesis regarding how well behaved the gold price tends to be vis a vis the Dollar Index.
You had an interesting formula. Have you an update ?
IMO Gold uncoupled from the DXY about a year ago, I believe I posted or commented as such last October 2018……fwiw I do expect the DXY to reach 100 and Spot Gold to be $1400 in the near future – looking at the EURUSD pair at the moment maybe I’ll put up a chart but the EUR is in a precarious spot on the bottom rail of a Multi decade long channel. It’s long been my thinking the CB’s use Gold among other tricks of the trade to control currency markets. I’m of the thinking Gold May have been set free recently because of the Forex market/Trade War. Have a look at the EURUSD pair Fully do you see what I see?
What I have done for many years — not rigorous but quick and dirty — is I go through a bunch of stocks different time frames monthly-weekly-daily and check whether above-below Bollinger Bands and then eyeball relation to moving averages. If it’s above (below) the Bollinger Bands I notate an abbreviation for “too high too fast”, “too fast too high” etc depending on whether the suddenness of the rise predominates visually vs its distance (probably doesn’t make much difference). If thinking of selling and it’s up there too high and too fast, I sell. If wanting to buy, I wait until the moving averages catch up and it’s well within the Bollinger Bands, preferably hugging the moving average. In using this method it of course is helpful to know the fundamentals, and also to see what similar stocks are doing.
I previously used more complicated and I think better methods of my own creation with some expensive statistical software comparing the latest points with things like confidence intervals of where it would have been predicted from prior trajectories. I don’t have time for that now so I use the above-described lazier method using off-the-shelf simple charts from something like bigcharts.com. It’s not too horrible.
Interestingly I often find myself putting down my abbreviations for too high too fast, too low too fast, while other methodology proclaims “BREAK-OUT!!!”.
It’s the old question of whether a move away from what’s been normal for the past hour-day-week-month is an aberration or a new trend, whether you want to jump on it or not. No certain way of knowing.
I think if you look at the literature of the 1980s and 1990s like Jack Schwager’s and maybe well before you’ll probably see the concept of too much too soon etc in various mathematical form and probably variations of this or that phrasing.
Been a long time since I looked at Bollinger bands! Gonna be fun. Rabbit hole #90210 queued up!