Sherlock Holmes at it again!
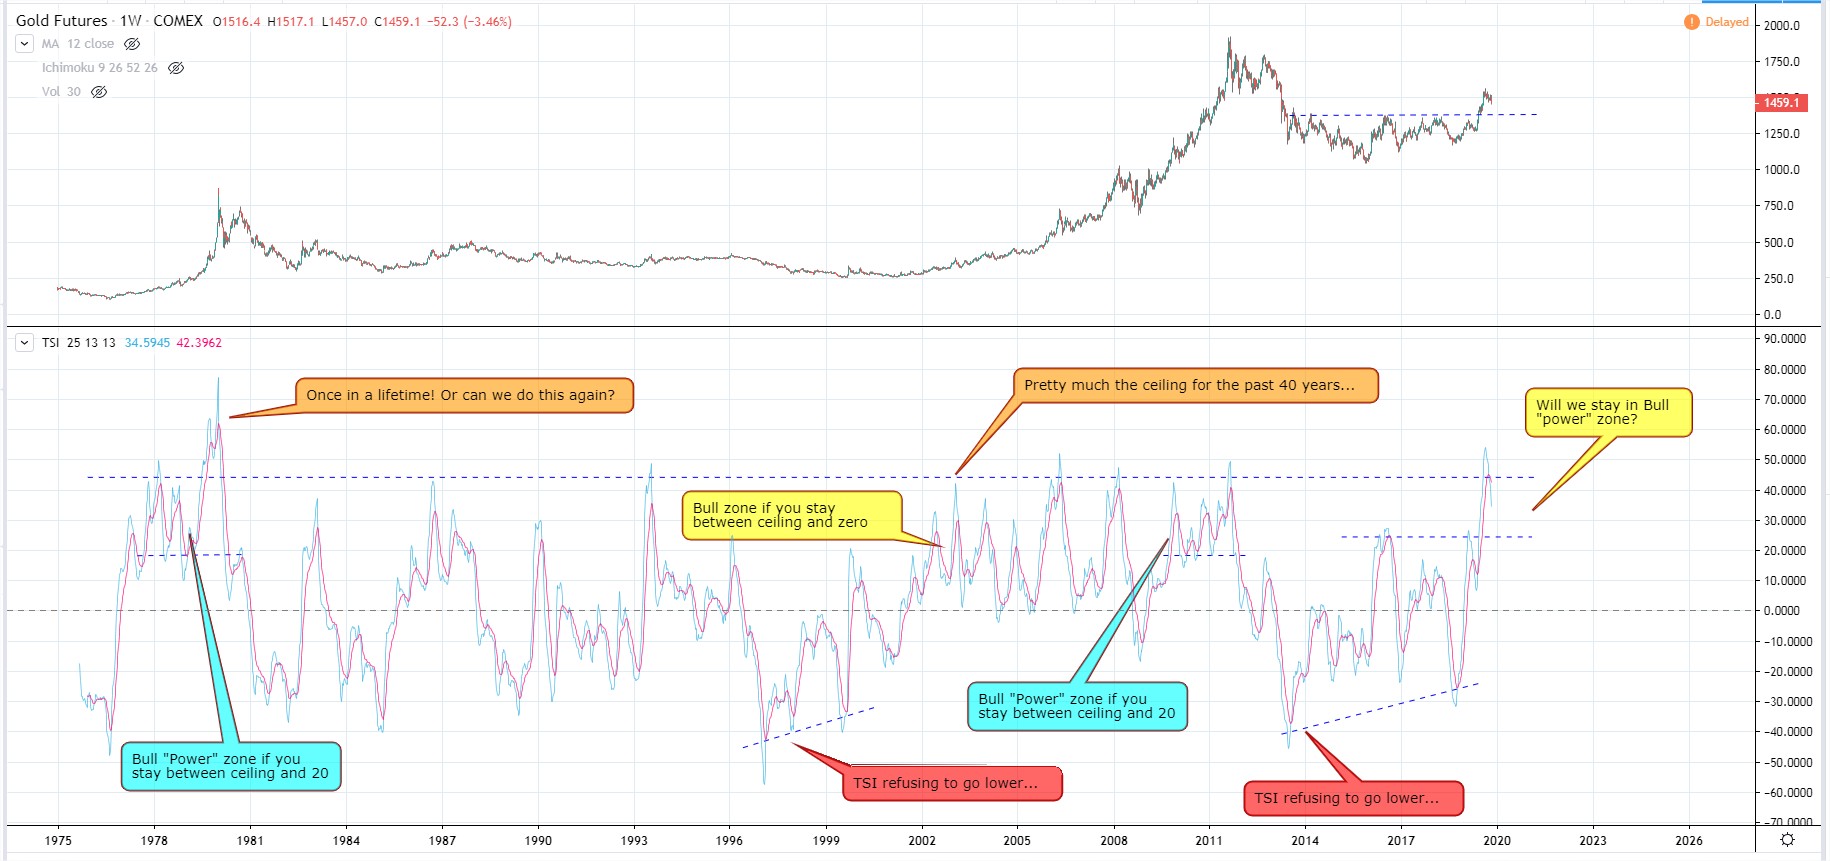
Going a step further with Fully’s chart using the TSI indicator (which I have never used before)…
Here is the same time frame Fully used, but extended the reference back to the 70’s. Let’s see how this behaved with more hind sight.
Now add a view via the “noised reduce” monthly chart. It shows a more bullish picture, that the action on smaller time frame are pullbacks, and not yet sign of longer trend reversals…
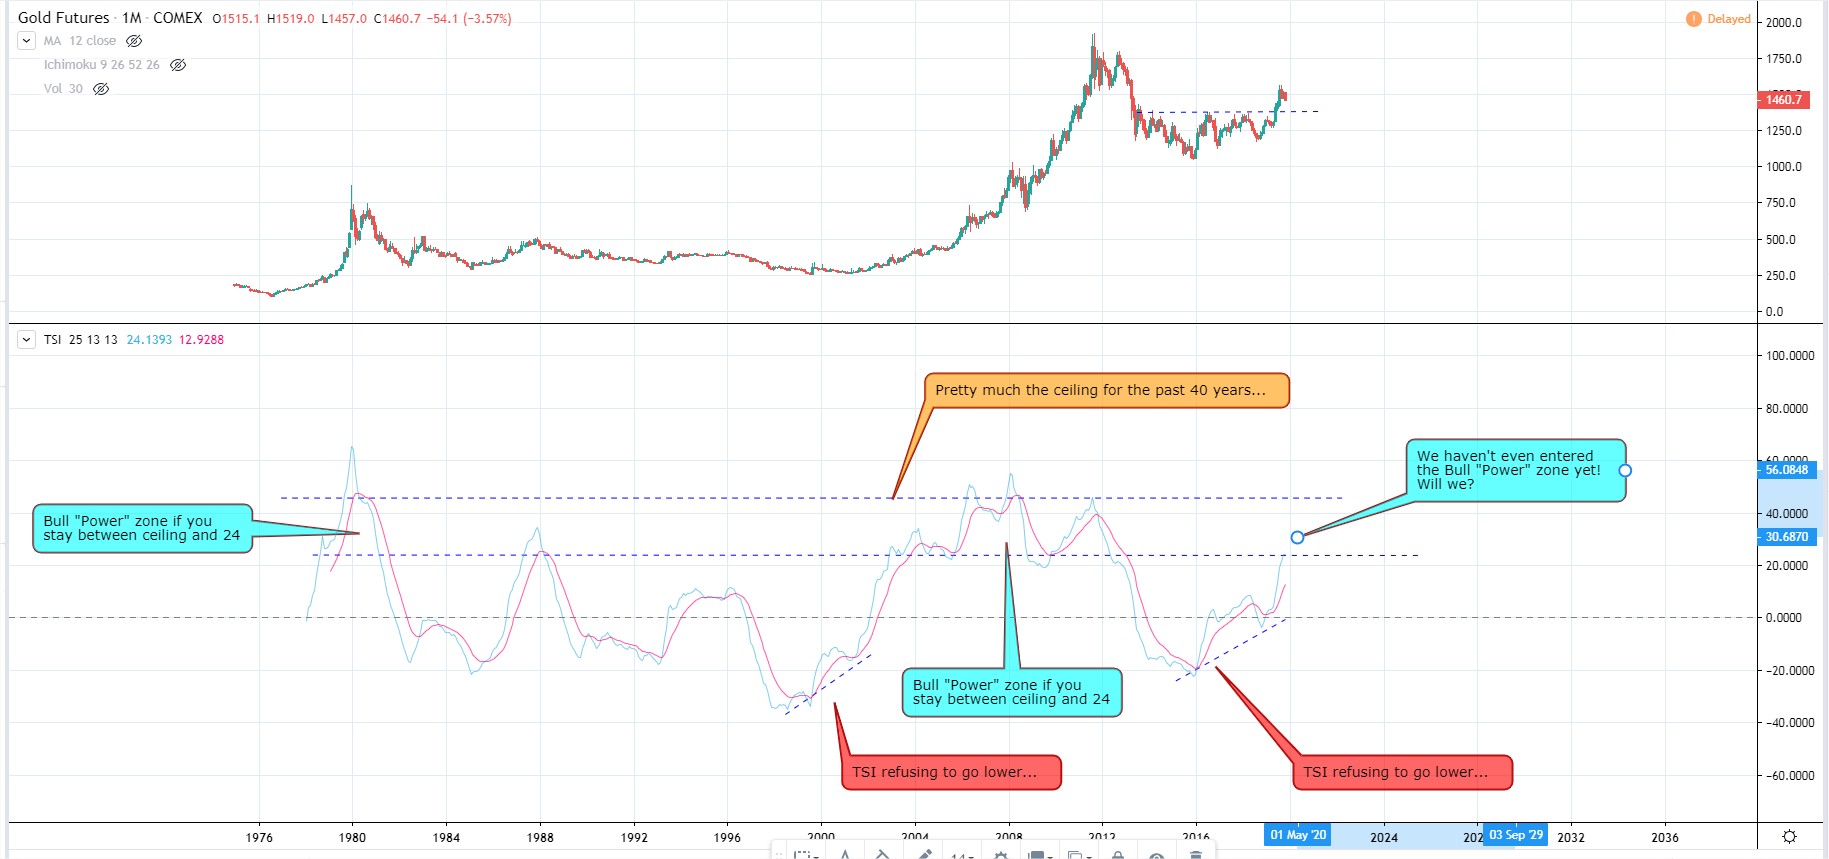
So indeed, we are gonna pullback now.. How low? NorthStar’s 1400 sounds plausible… or anything close to that region. But the longer trend shows we have much more room to grow upstairs.
The only time TSI got this high on monthly chart and stalled, was in 1987.
The TSI is my favorite Indicator
There are so many to choose from …but it seems to be the most useful and predictive …for me at least
I see many chartists us10 or more indicators…gets muddy IMO.
I’m definatley gonna use more of TSI in the future. More I read about it, more I like it. #KISS