50 Years
I had to do some research on how to compare assets for 50 years
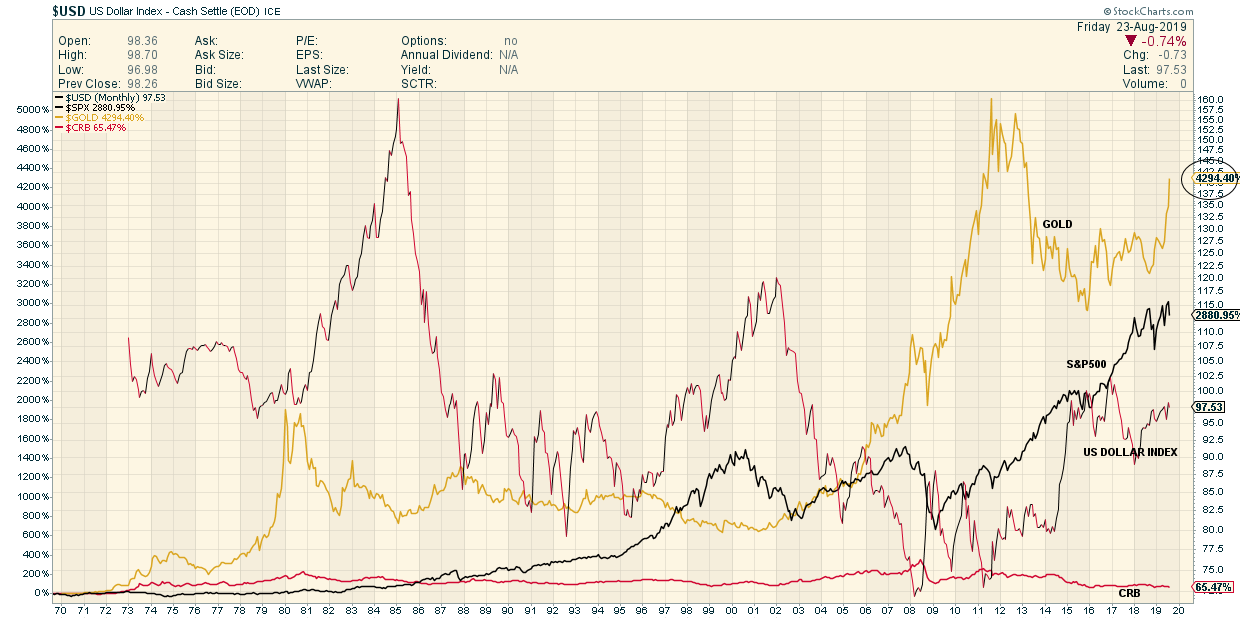
There is a feature on Stockcharts called price performance.
This chart starts with the US Dollar Index which is show as an absolute value
Then I added the % Performance from 1969 to the present in
Gold
$SPX (Stocks)
$CRB (Commodities)
The results are on the right side expressed in % increase
Manipulate This !
Tell Your Friends
Thanks Fully for all the hard work and guidance!
Just a way to say thanks, a heart warming story……:-)
https://www.huffpost.com/entry/hillary-donkey-rescued_n_5d616adee4b0dfcbd48e3e75
Thanks Sir Steins1
That’s terrific
She’s a beauty
Go figure…a female ass called Hilary
🙂
Why have I encountered so very much pessimism since the recent intermediate-term bottom around the beginning of 2016?
Quite a bit of “bear market” discourse. I suppose there have been maybe 2(?) “bear markets” in gold since then for those with time-frames shorter than mine. And that is fine. Maybe even more than 2 “bear markets” for those agile enough to trade frequently.
What will the discourse be like with the next correction? When will it come? How much is it worth caring?
What would it take to change my opinion that Au is going up?
Karl, for myself and still “holding my breath”, it’s mostly two events….
The first was when gold went to 1900 and many of us had made a ton of money.
But then it all turned down and I had no idea what I was doing, “hoping, willing, demanding that gold had to go back up!
And gave all my gains back and then some.
The next was the 2016-17 run where basically the same thing happened. Spock had nailed it with great picks and said he wasn’t selling when
it all turned down. I’m about positive that he advised everyone to do what they thought was best, but he was holding.
If I remember right, he said that we just don’t know when gold will shoot back up and even if there is a big draw down, the returns will out pace the losses by a large margin.
I haven’t liked it when Spock has been criticized because he basically told subscribers to take responsibility for your decisions.
What has been so great for me personally is now having this “arsenal” of great guidance!!!
My appreciation for Rambus has grown so much over the years regarding his discipline!
Plunger, both discipline, history and fundamentals.
Fully, NS and all the rest offering huge contributions!
I feel now, if I can’t at least preserve my assets and even more, do well, I’m just a moron! LOL!
Back to Rambus, the guy is cold as steel regarding his discipline! I’ve grown to appreciate it so much and it is one of the lessons that has stuck the most. Probably even more is his comment when he sells for a loss….”I’m selling to minimize my losses.”
We can always live to trade another day.
I just mean to point out how quickly moods change, my own included.
Moods are so hard to control! Right now, for example, I feel almost a desperate urge to do something. However I can’t figure out whether it’s to buy or to sell! I prefer to go by individual stocks’ charts rather than indexes or underlying metals’ — I am finding just about all of them ambiguous. So I guess it’s sit and be uncalm.
I also would like to point out that I have repeatedly said that those who have held the Spock matrix may end up looking like geniuses (provided they sell when the time comes). I’m not sure, but I might actually surprise myself by ending up right on that one. (I’m not one of those who have held on. I myself sold many of the S-rocks that I decided I did not like at all, increased my holdings in other S-rocks, bought non-Srocks–depending on news, individual charts–so I did a lot of adjusting.)
And I’ve never heard you criticize Spock either.
I hadn’t re-subscribed to him for a while either. But just recently did and adjusted everything to his recommendations. And was lucky to jump in with Plunger right away.
But all in all, very “gun shy”!
GUN SHY……(especially of a hunting dog, alarmed at the report of a gun)
We’re like a bunch of hunting dogs looking for gold nuggets! LOL!!!!
I have criticized Spock, but maybe discreetly?
On CRB. I am afraid I am ignorant yet may repeat myself even after this.
I am skeptical.
Are we perhaps seeing something like the world’s average temperature at a given time — a figure that perhaps does not take into account N vs southern hemisphere, site, reliability of a weather station’s measurements, etc? In other words, are a lot of big differences perhaps being averaged out? Also, how reliable are the underlying data? I do not know.
Does the average take into account how much I pay for something (taxes, transport costs, retail increase over wholesale, fees…)? Is it possible that Zn goes down while natural gas goes up? Does CRB include real estate? How good is it for those commodities that aren’t traded much in public. Does it take into account long term contracts and size of them? Does it take into account whether there are contracts of, say, the PRC, with this or that African entity to produce copper? Does it make adjustments for when the speculators hoard oil by putting it on tankers that sit out at sea (maybe it shouldn’t)? Does it take into account the bluffing over Cu stockpiling, possibly with a bit of sham-pricing(?????) that I wouldn’t be surprised may occur in London and Shanghai (as well as on the Comex) even w/o the trade wars? I don’t follow these matters and know even far less about them than about gold, but I do not assume the individual prices are necessary trustworhty — much less averages of commodities, some of which may be going up, others down, also depending on where,and to whom — as well as of course in what currency.
It’s not that it’s useless info, and I’m grateful to see it. I just don’t know what to make of it.