$Silver
Probably preaching to the choir here, but we should see some pretty special things from Silver. Take a look at the ADX indicator at the bottom of the chart below, and note the green shaded area showing the low level that the (black) ADX line is starting from this year – in combination with a (green) +D1 crossover. Last year the ADX line hit a low of about 9.48 – the lowest since reaching about 8.26 in 1992. Now compare to the “baby-bull” rally in 2016. These are historic levels to start from, people.
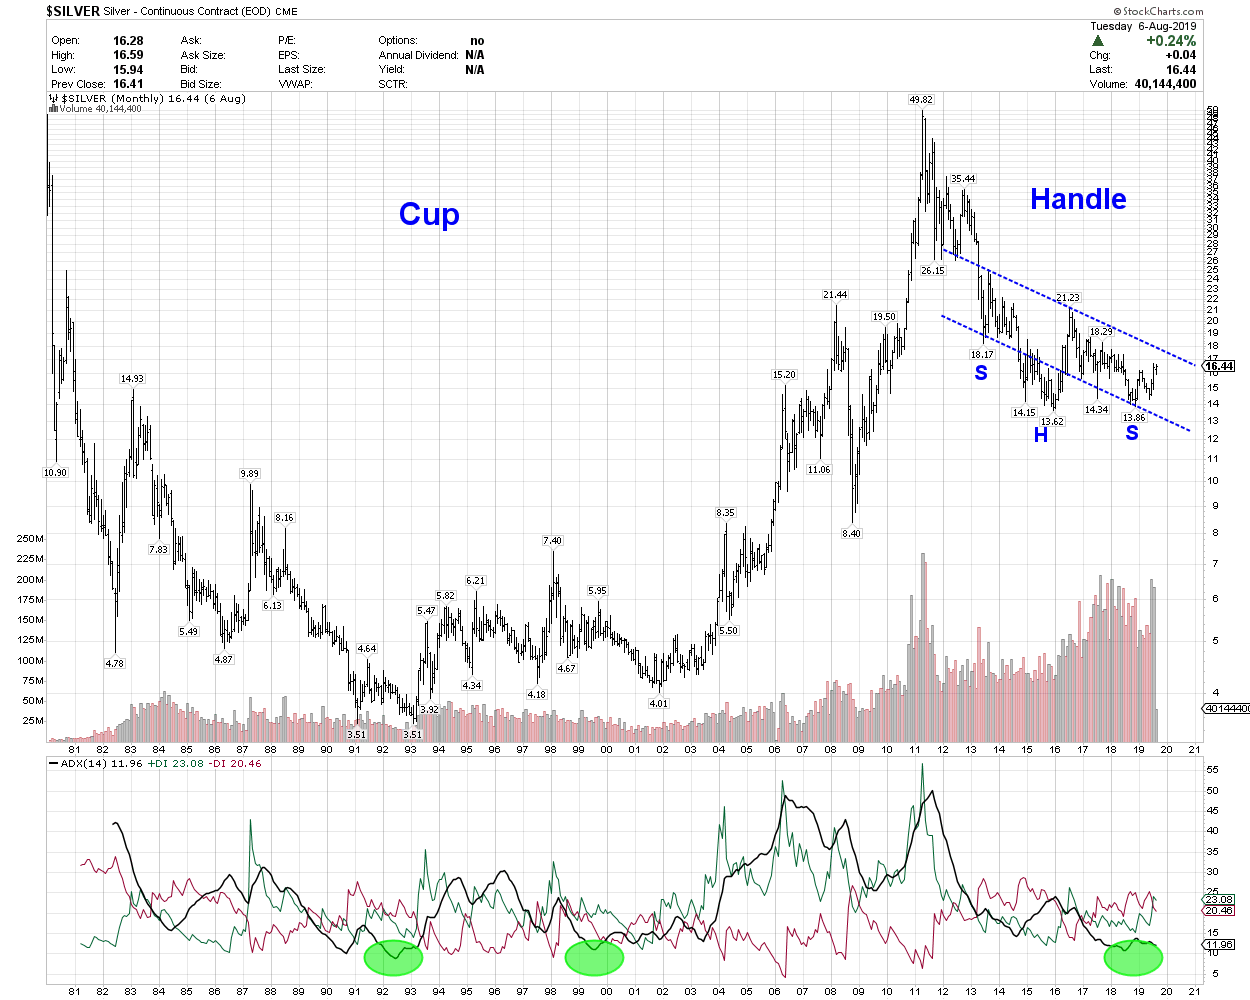
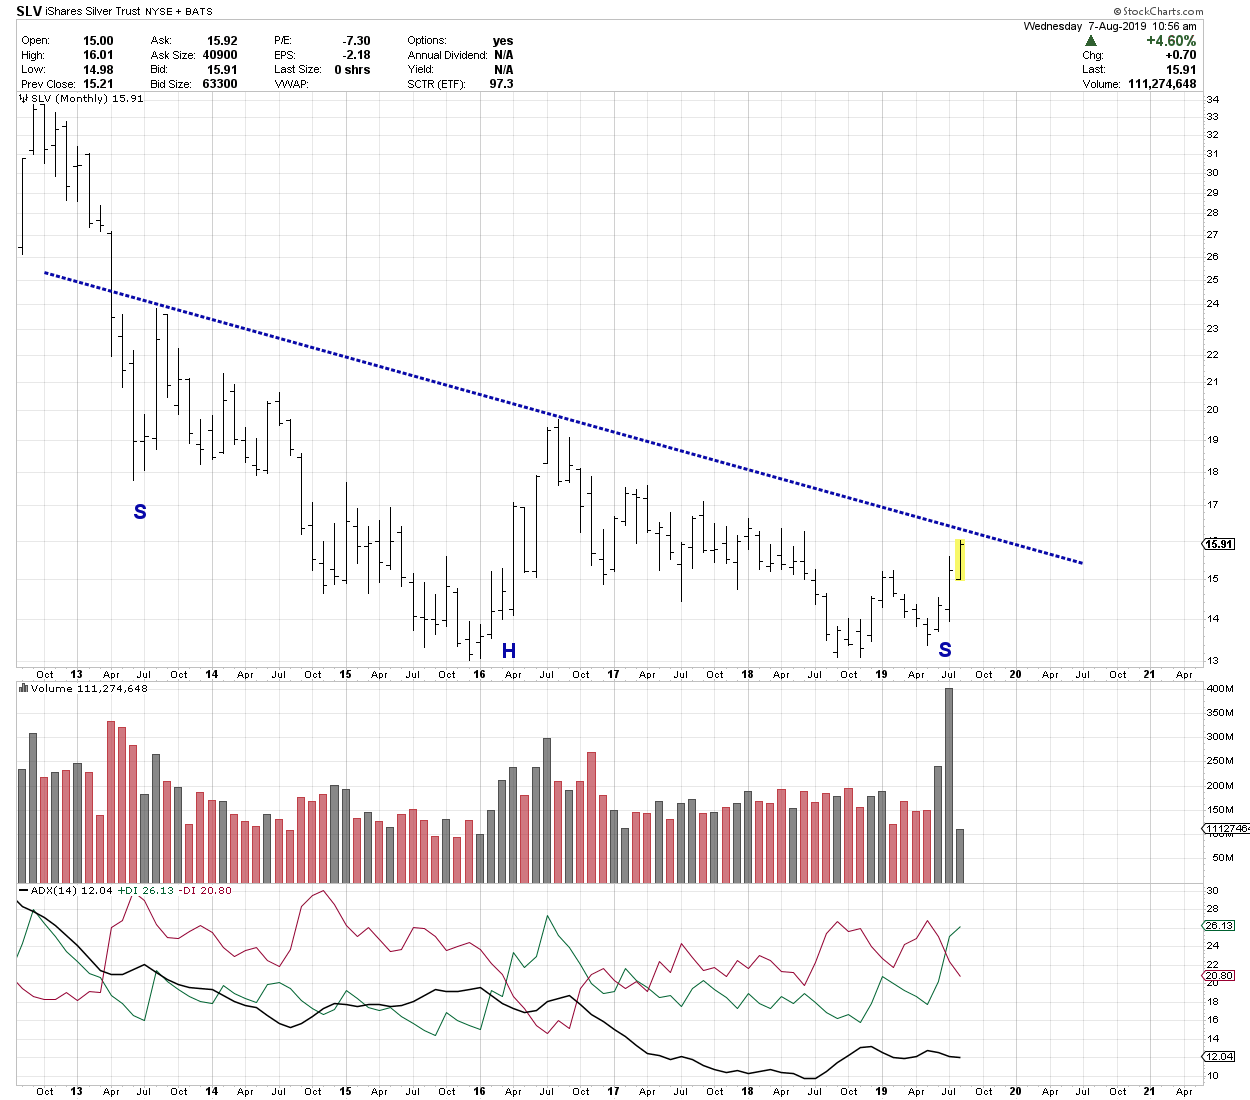
Like Gold, which has broken out above its massive head & shoulders formation – Silver has its own H&S formation – although slanted downward and asymmetrical. The SLV monthly chart below shows that, with today’s price action – Silver is knocking on the door of a breakout, which seems inevitable at this point. Mother Nature will be served. The massive Cup & Handle formation shown above wants to complete (note the recent massive volume spike) and the breakout of Silver’s H&S formation will lead the way.
Looks like 100 dollar Silver from that cup and handle formation. Thanks for the chart.
Yeah…just your average 39-year (and counting) chart formation in completion mode?
I think it’s more than a 100 – bigger and long basing pattern is a stronger move – also if we look at the log it clearly surpasses 100