Moving Average Should Be Our Friend
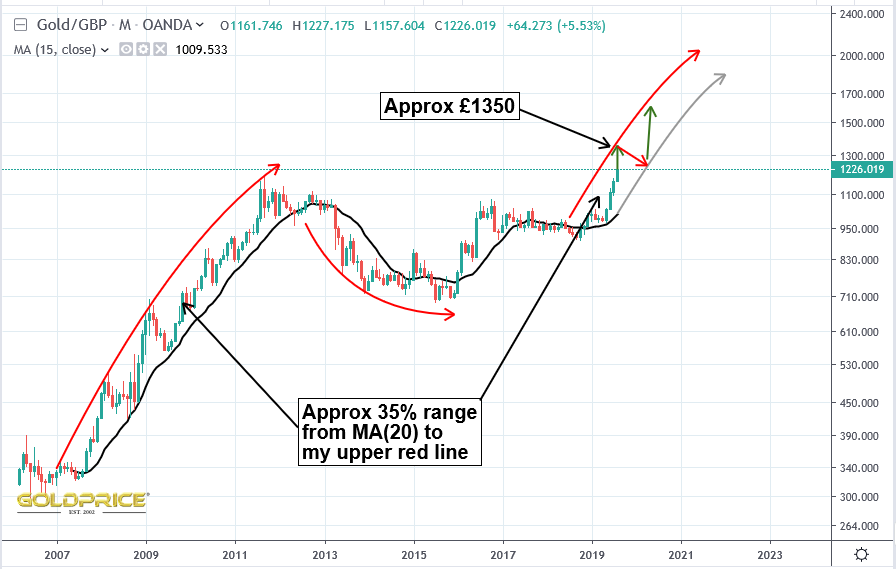
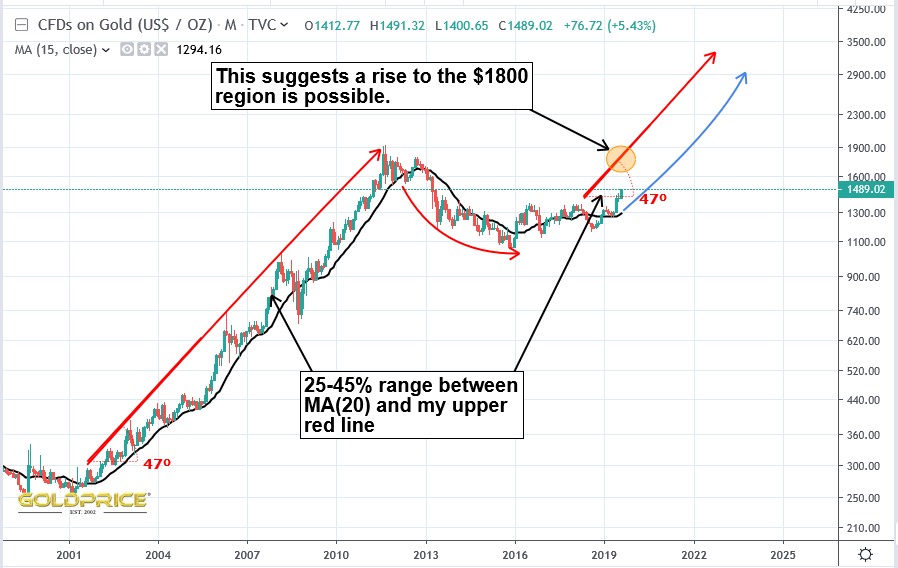
At least until the 8 year cycle low (mid-16 year cycle), where it may be breaches as in 2008. Anyway, on the assumption that we have now seen THE low in 2016, and this breakout is real, and the start of a new trend, we can start to do some analysis. Looking at the last bull run from 2000 to 2011, we can fiddle about with the moving averages to find the one which offered the best support. I’ve done that for the charts in GBP and USD. I’ve defined an approximate range from the moving average to the tops of the price spikes and drawn a channel which contains them. Applying that going forwards may give us a very useful reality check and tell us when we’re approaching ‘the limit’ for any particular move. This doesn’t, of course, take into account any unforeseen, major event that blows up and rocks the entire global financial system…