GOAU:GDX , GOAO:GDXJ, GOAU:XGD
Is the new GOAU ETF a superior gold stocks performer? I’ll try to post a daily and a weekly ratio chart after market close on Fridays as long as the board finds the information useful. We will compare GOA with XGD, GDX, and GDXJ.
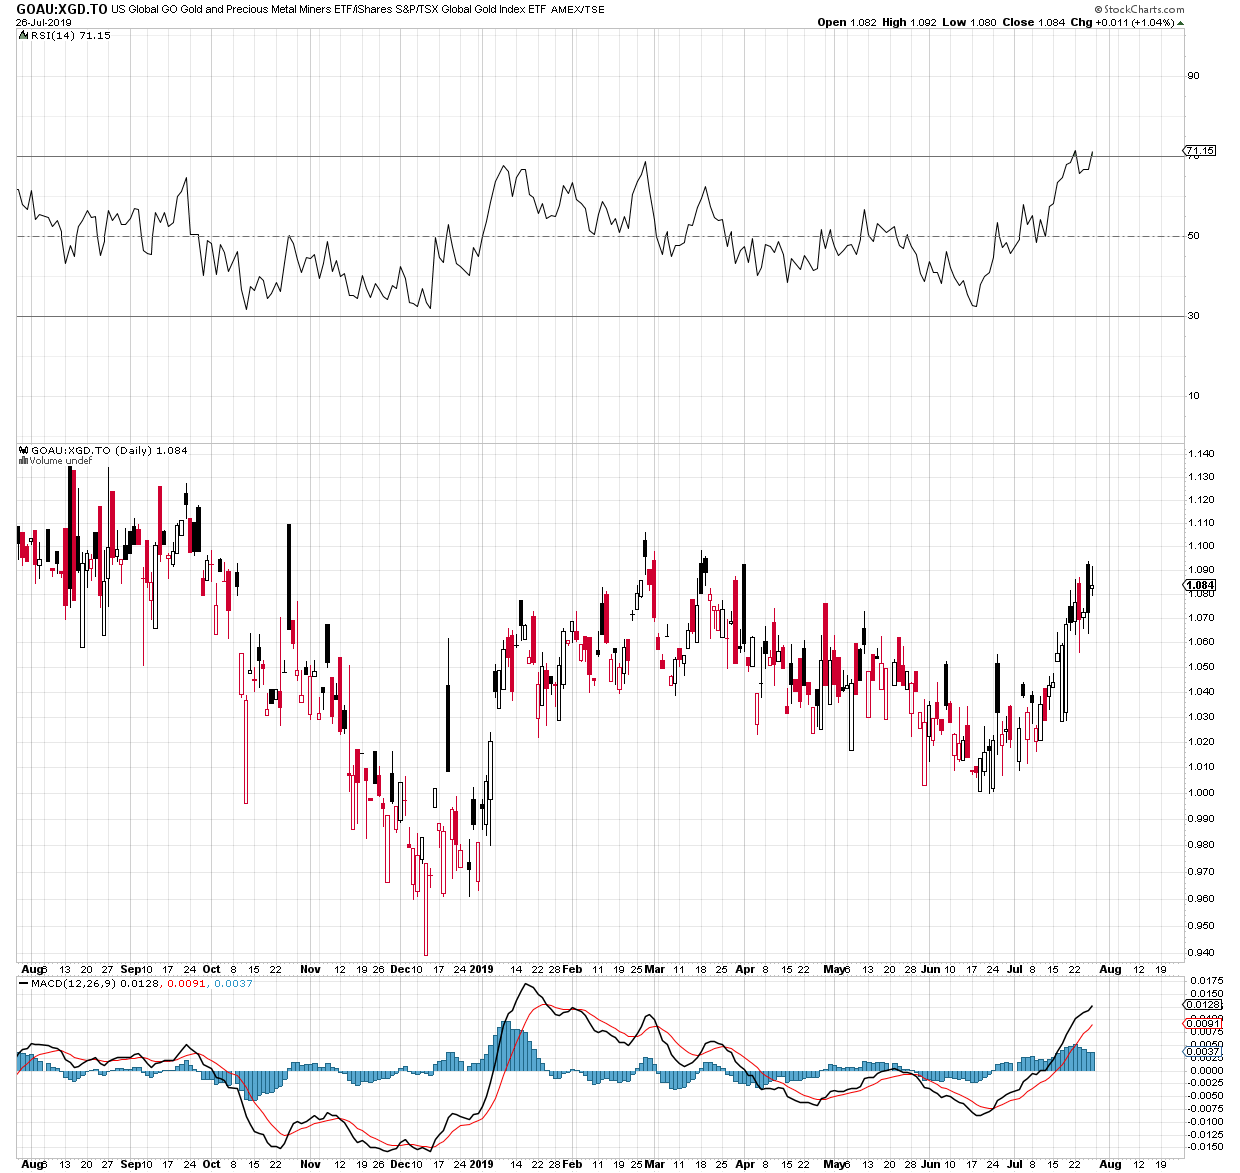
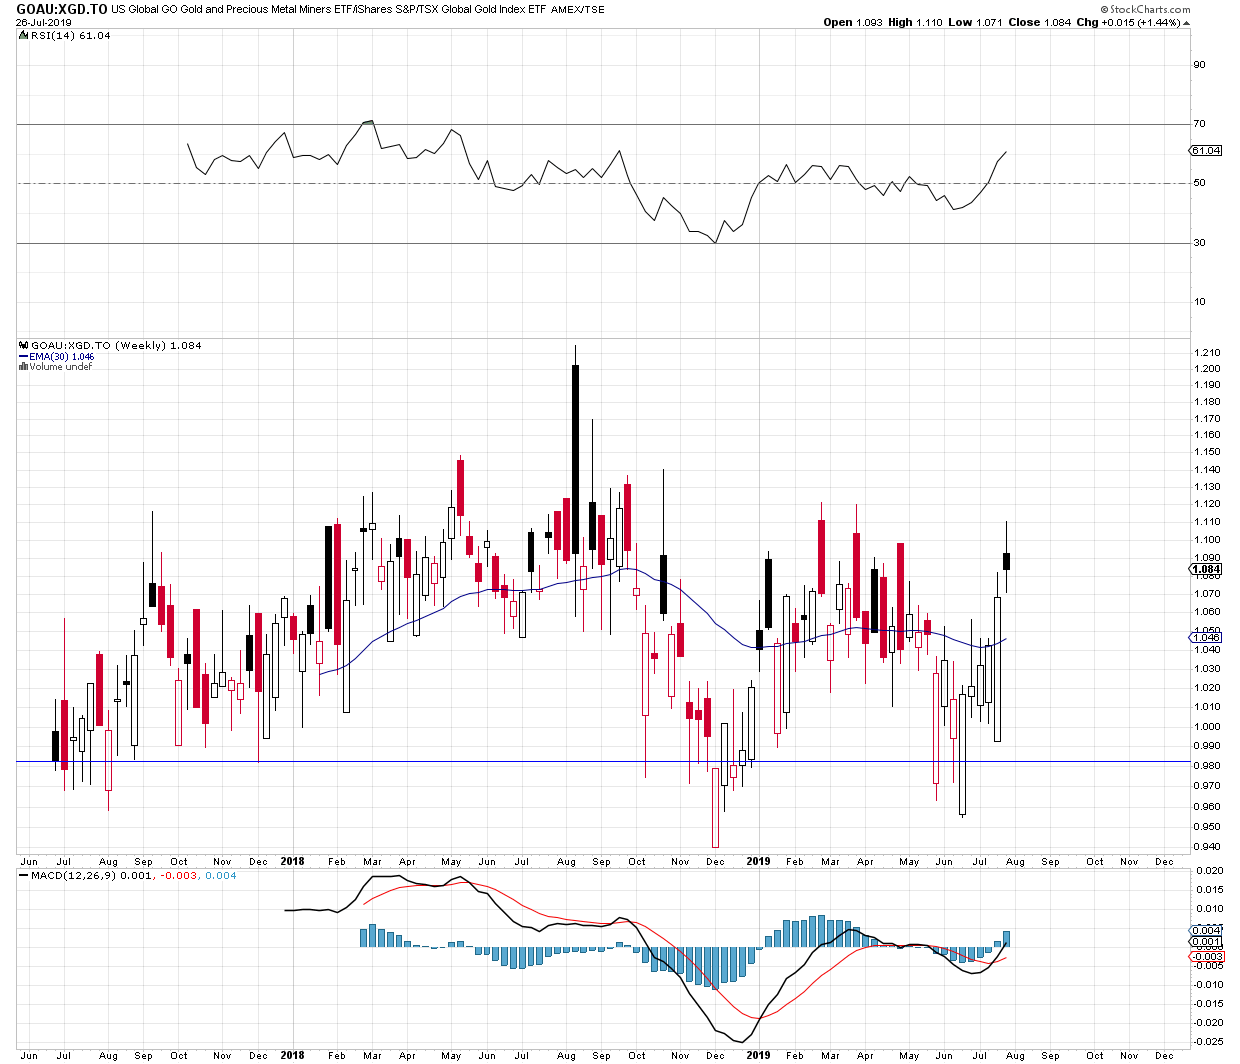
The daily chart will cover a one year time frame. The weekly will cover the time period from the first trading day of the GOAU ETF until present day.
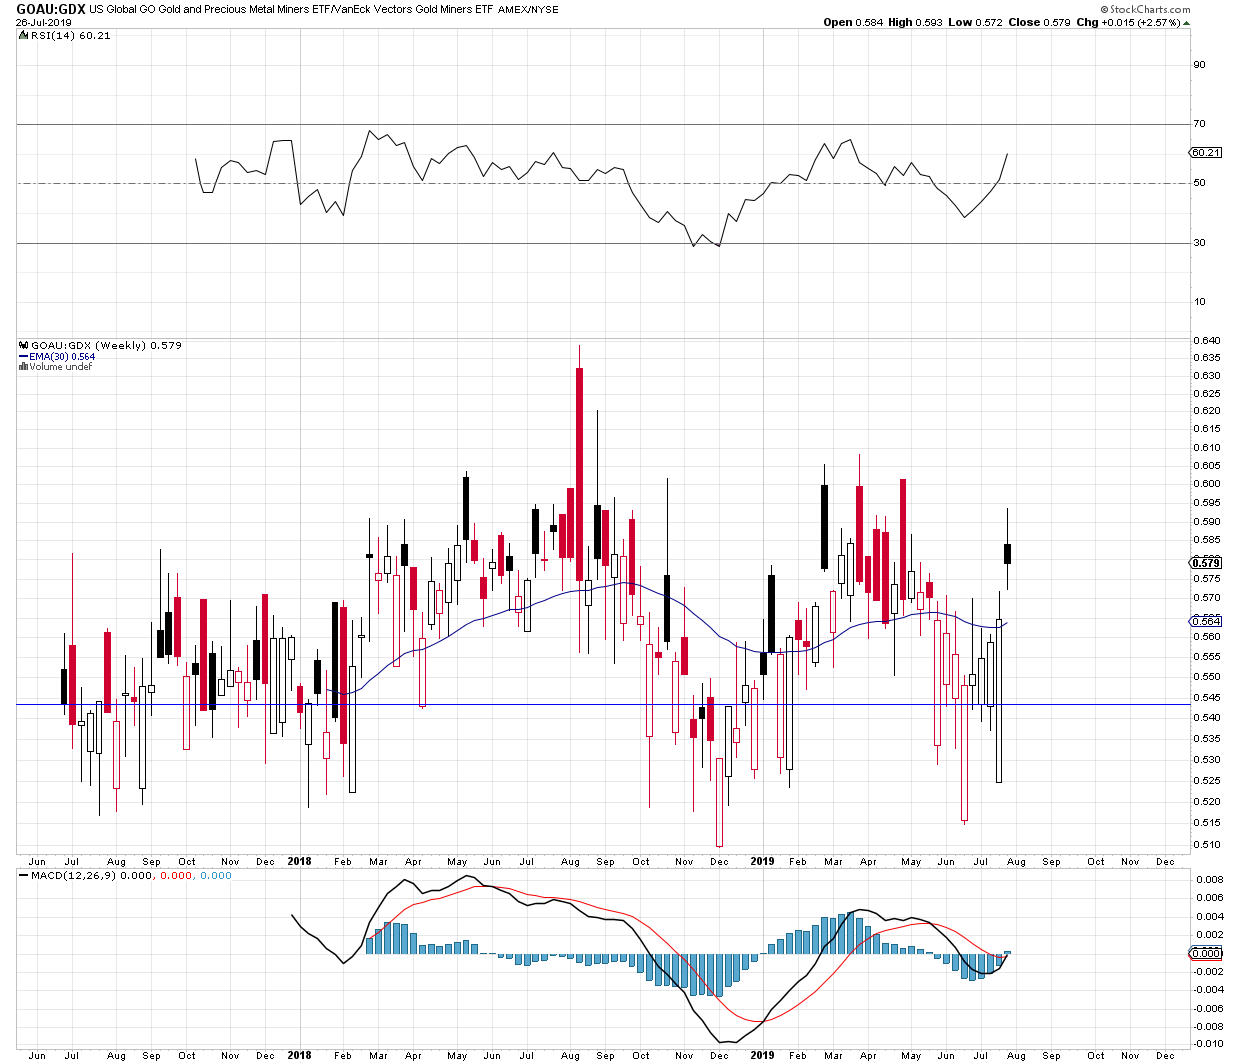
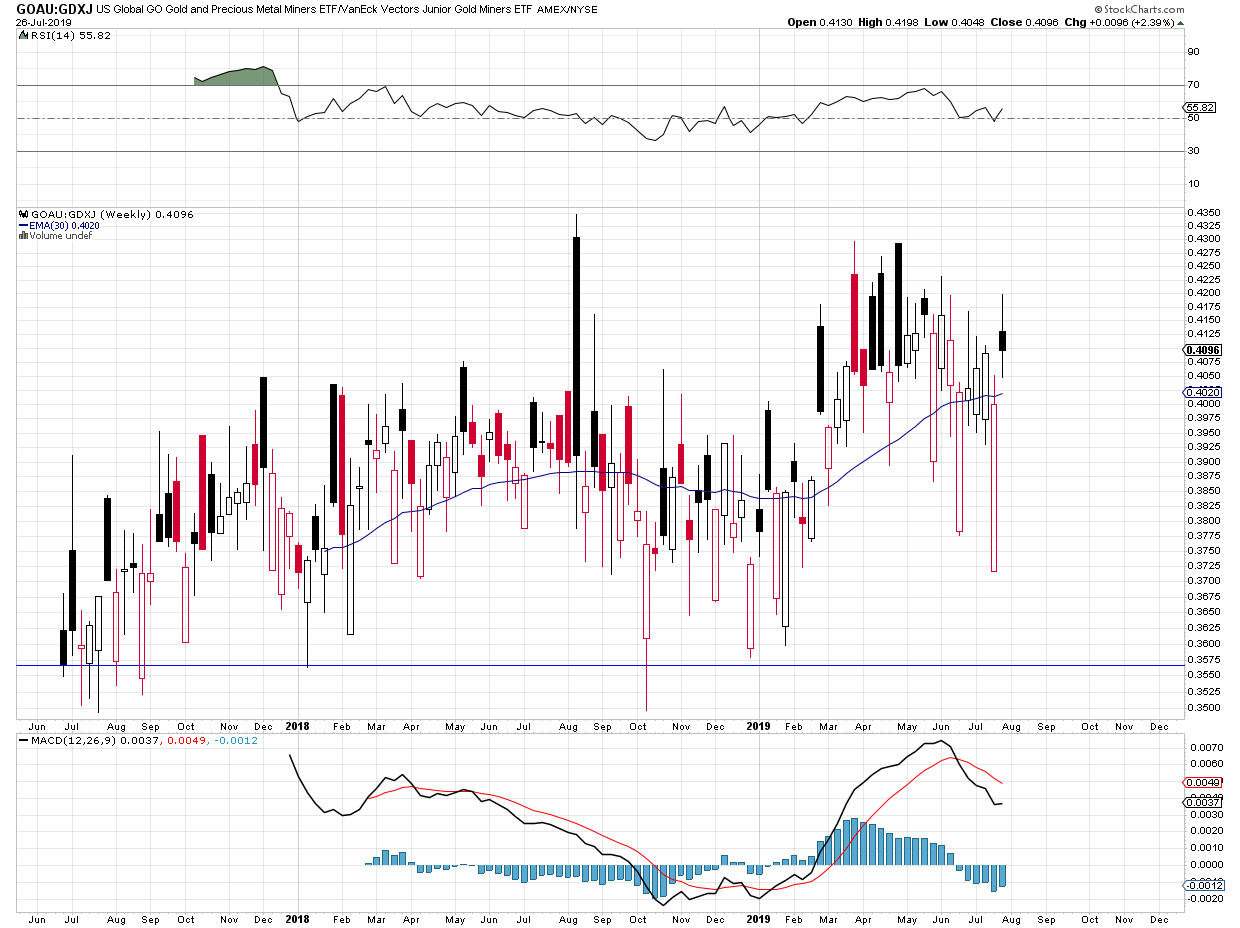
The horizontal blue line on the weekly chart is the GOAU ratio close after the first week of trading. Above the blue line GOAU is out performing. Below the blue line GOAU is under performing.
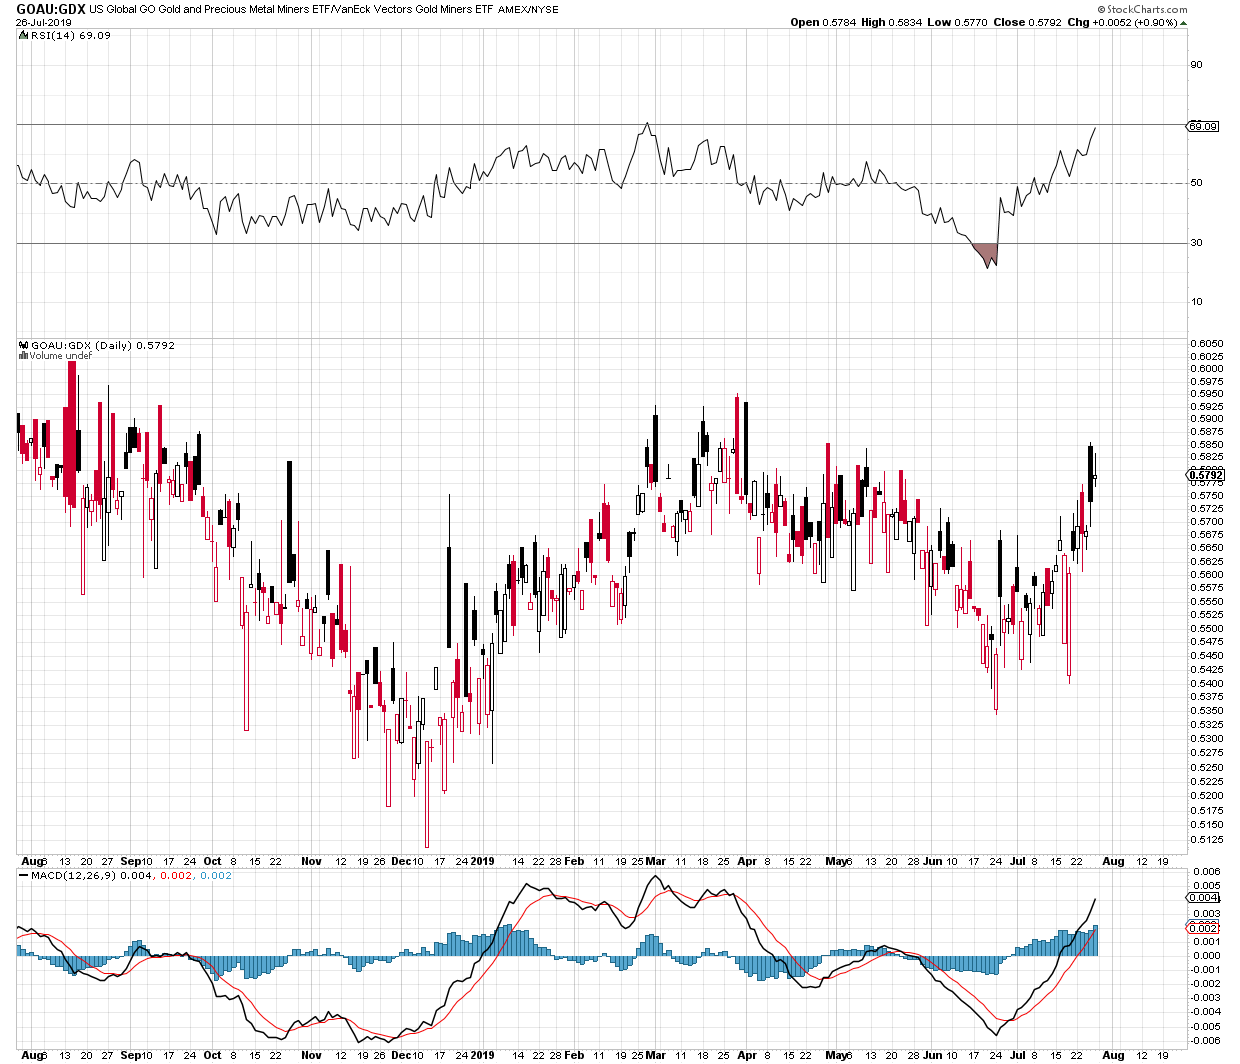
GOAU:GDX Daily
GOAU:GDX Weekly
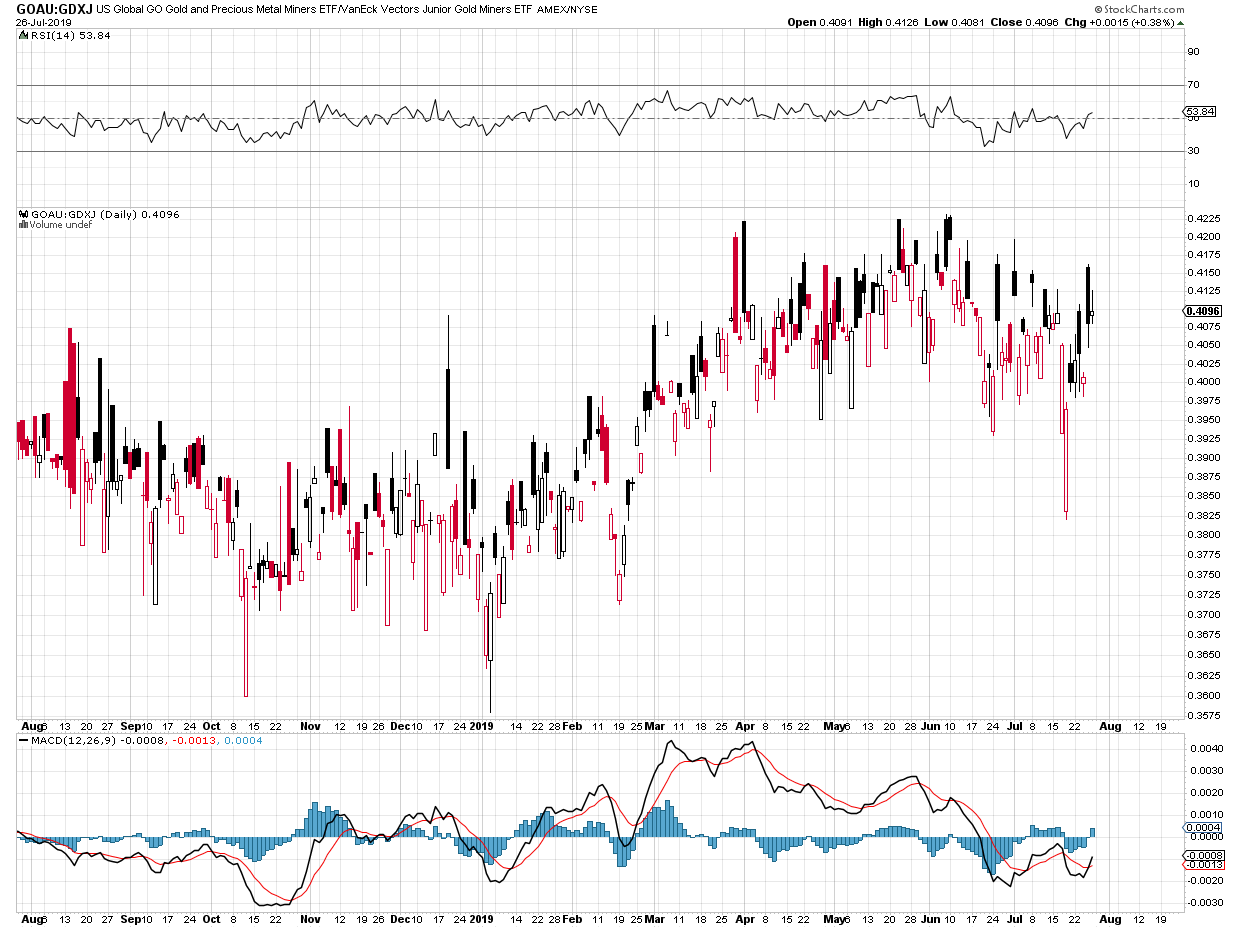
GOAU:GDXJ Daily
GOAU:GDXJ Weekly
GOAU:XGD – Daily
GOAU:XGD Weekly
GOAU Holdings
10.20%
ROYAL GOLD INC
9.49%
WHEATON PRECIOUS METALS CORP COM
9.28%
FRANCO NEVADA CORP
4.23%
NEW GOLD INC
4.22%
CENTERRA GOLD INC
4.22%
HARMONY GOLD MNG LTD
4.03%
NORTH AMER PALLADIUM LTD
3.90%
OSISKO GOLD ROYALTIES LTD
3.69%
SEMAFO INC
3.50%
DETOUR GOLD CORP
3.20%
LEAGOLD MINING CORP
3.19%
WESDOME GOLD MINES LTD
2.97%
ANGLOGOLD ASHANTI LTD
2.95%
KINROSS GOLD CORP
2.86%
B2GOLD CORP
2.84%
KIRKLAND LAKE GOLD LTD
2.78%
SILVER LAKE RES
2.57%
NEWMONT GOLDCORP CORPORATION COM
2.56%
GOLD FIELDS LTD NEW
2.42%
PERSEUS MINING LTD
2.16%
ACACIA MINING PLC
1.97%
HIGHLAND GOLD MNG
1.86%
IMPALA PLATINUM
1.85%
CENTAMIN PLC
1.81%
PAN AFRICAN RES
1.81%
ANGLO AMER PLAT LT
1.69%
AFRN RAINBOW MINLS
1.69%
RAMELIUS RESOURCES
0.07%
Cash & Other
https://www.usglobaletfs.com/fund/goau/#holdings
The Kitco interview that sparked the quest…
https://www.kitco.com/news/video/show/Kitco-NEWS/2488/2019-07-25/Miners-Blew-Gold-Out-of-the-Water-in-2019-Can-This-Last#_48_INSTANCE_puYLh9Vd66QY_=https%3A%2F%2Fwww.kitco.com%2Fnews%2Fvideo%2Flatest%3Fshow%3DKitco-NEWS
Go Gold !
Great lets see if there are appreciable differences in the 3 standard ETFs vs the new GOAU.
I like the portfolio it holds for sure
Please post the holdings as well each week
Thanks Fox
Well done, Silver Fox. Wish I knew how to do such things. Looking forward to the weekly updates!
Don’t sell yourself short, Silverboom. The chart work is the elementary part.
You’re the man of the moment. We learn from and help each other. If you have questions – ask. Someone is sure to shine a light where you need it.
Cheers
Thanks SF. I mentioned what I thought was kind of low volume before, is that a concern at all do you think?
The holding look really good. Thx
Not sure I understand your question, Steins1. Do you mean low volume in GOAU?
Yes, low volume in GOAU. But I don’t know if it is or not, that’s why I wonder. I’ve just heard comments about some of the smaller stocks, or micro caps being hard to trade because of low volume. However I do find in my Fidelity account I’ve had no problem. Thx