Reverse symmetry – hang on a minute. Not so fast!
Here is another reverse symmetry chart suggesting one more washout before the big up-move.
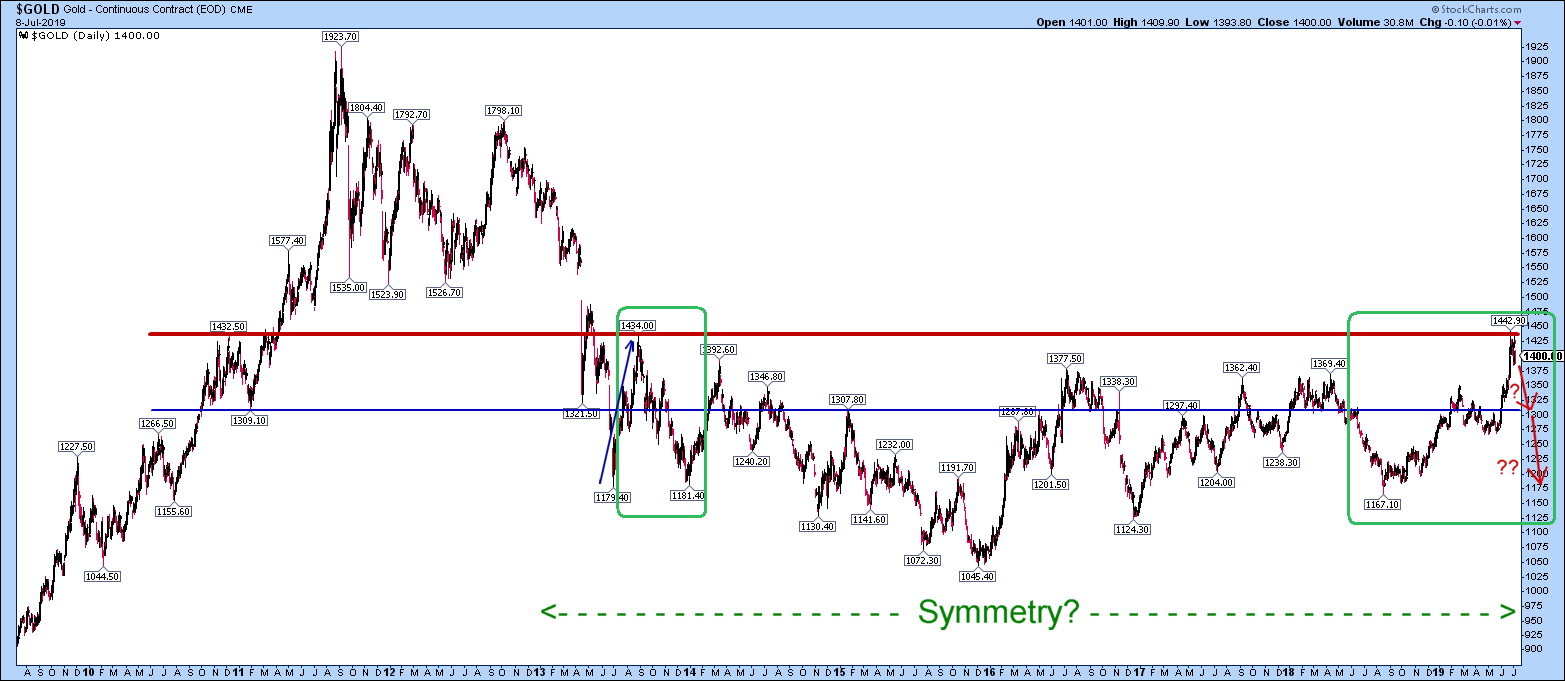
I’m not always convinced by reverse symmetry anyway, except in a very general sense because the symmetry is very, how can you say, generalized. The chart in the middle section around the lows at $1045 have little clear symmetry. Counting the lows is difficult. However there were two clear visits to $1180 back in 2013 and I don’t see any symmetry for that so far.
Anyway, this is just to pour some water on the party:
I don’t feel in my bones that this is so likely with a $1425 close possible tonight on gold.
Once the re a jump through the $1540 resistance is possible given the dive through it on 12-15 April 2013.
This is why I like the $1430 level as a key level, two touches in the past or not. This was the resistance between the “balanced” part of the bull market and the mania part. The further moves to $1577 and $1920 in 2011 were too early to stick. It looked like a “3 peaks and a domed house” pattern to me, plus whatever psychology that implies and indeed it did return to the base of that particular pattern by having a bear move to the 1100s and beyond in 2014-2015.
The door to the “excitable” price area of $1450-1900 (and potentially more) was firmly shut in late 2013 on the failed rally following the crash and the point of recognition event in April 2013.
The change in psychology is coming to turn those sellers back into buyers. Whether it means a rocket ride straight through $1540 towards $1800, who can tell? Or will $1540 just act like “normal” resistance? I think that depends when the change in psychology occurs. It’s coming I think – but when?
Gold is making new all time highs around the world and currency after currency is approaching all time highs, with very little chart resistance left in the way. The momentum is becoming unstoppable now (in my view).
You might be right and that is the “feel” I also get. It’s breaking out in advance of a new era of currency debasement. That could be extremely bullish, since that news is not in the markets in general, I’m sure.
In that case, the reverse symmetry is just a big picture thing and not to be taken as gospel in terms of shorter term trading, just in terms of potential big moves on the big picture, IMHO.
Gold is edging up towards the close and Bid/Ask US$ 1425.30 /1426.30 on Kitco.
If it holds, it’s a beautiful daily close at a daily high.
Also, 1145.94 / 1146.75 in GBP right now. That is a huge price (the 2011 “mini-mania” high was around £1200) and the pound is taking a knock on political matters, shall we say – and more because the UK as an economy is bust, I s’pose.
I call that 2011 high a “mini mania” because perhaps the real mania is to come.
Agree with your points Dave. If we see a large stock market correction, it’ll be very interesting to see how PM stocks perform.