Motives
I first started reading Goldtent during the final run up to the 2011 top (a friend and colleague showed it to me). I learned a lot about how useful/helpful chartology and especially cycle analysis can be. Many expected the fun to carry on, but the cycles said lows were due in 2008 and 2016. We all know the rest.The problem with being online is that I don’t know you, and you don’t know me. That being the case, I always give people the benefit of any doubt, and if they don’t seem open to a healthy debate, I’ll just move on. In climate science and forecasting I’m very used to this. The whole climate debate is clouded with cheap headlines and false data on both sides of the discussion. Science seems to be so mistrusted as a result. In fact, I’d go so far as to say it’s becoming cool to pretty much ignore and mock scientific research and advice. So many times I’ve been told by someone online that I know nothing and they have all the answers when it comes to changes in global climate. EVERY time it has turned out that they can’t even explain the simplest examples of atmospheric dynamics in the town where they live. How can you hope to grasp global climate if you don’t even know how to explain the basic building blocks of the argument ?
Why am I telling you this ? First – I have very thick skin and am very used to angry response online (I don’t retaliate). Second – it seems some here are questioning my motives.
Sometimes I’m right, sometimes I’m wrong. 100% accuracy would be a neat trick, but using my science background does seem to help me. The main thing I’m trying to bring though, is an ability to present my thoughts in a colourful and easy to understand way. My current work specialism requires clear communication with emergency responders, both in written and verbal format. I’ve spent time broadcasting on local TV and radio, as well as the odd appearance on national TV. My previous job involved briefing RAF aircrew on weather conditions for low level sorties across the UK, so clear communication and hazard identification were essential.
Here’s an example of a chart I posted last October…
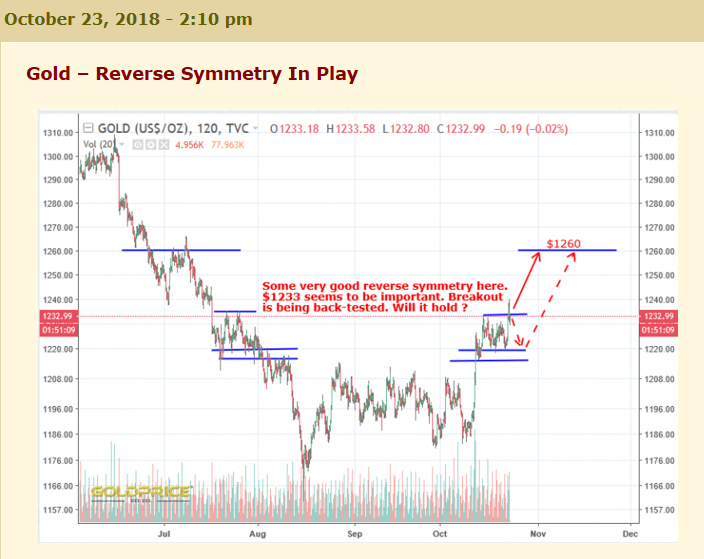
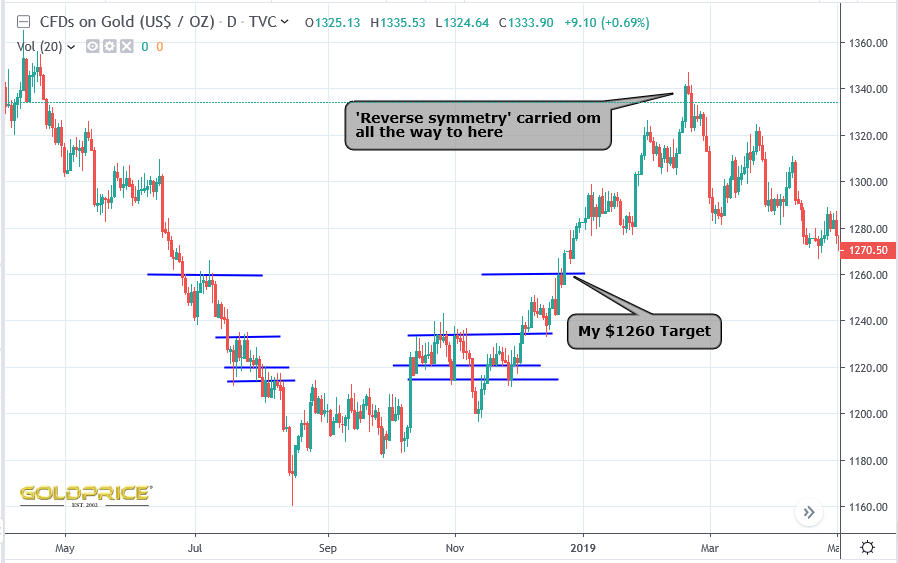
and this is what then happened…
I’m not always right, but on the other hand, I don’t shout about my successes either. I stand accused of ‘talking my book’. Not a phrase I’m very familiar with, but it suggests I have underhand motives.
This is my position (and has been since we bottomed at $1050)…
1 – 2016 was the 8 and 16 year cycle low for gold
2 – The last 6 years has been a drawn out basing pattern (the bowl I’ve been drawing on all my charts)
3 – A break below $1220 region negates my thesis.
4 – A break above the $1350-$1400 resistance zone puts us firmly in bull territory.
5 – GSR may well rise further if (like last time) gold rises faster than silver for a little while. However we are at a historically high point already.
6 – Rising stock markets are common during a gold bull, so nothing to be frightened of.
7 – The rate hike cycle is done. More monetary madness is coming.
8 – The dollar is in a cyclical decline and will break down from the bearish rising wedge.
9 – Gold will break up from its bullish falling wedge (this has now happened).
10 – Gold will break out globally (this is happening now).
11 – Gold in USD will join the rest and break upwards (I have high confidence in this, but ALWAYS acknowledge the possibility that I am plain wrong).
I seldom post charts on individual stocks because they are each subject to very specific controlling factors. When I do, it’s because I feel they have something important to add to the debate. I make these charts regardless. If I were to stop visiting this site, I’d still be drawing them for my own use and posting on my Twitter feed. Humility is important here because weather forecasting and financial forecasting can make you look very foolish. The trick is to be able to spot when your predictions are going off track. So far, I don’t have any reason to question my overall view. As I’ve said so many times, a break below the base of my bowl, and especially the $1220 area will turn me bearish. This isn’t a competition to prove who’s right, it’s an attempt to use everything we all know collectively to inform our investing decisions. Please question everything I write, and if you can, present an alternative view (with charts), so that we can all benefit.
As always, thanks for reading.
NS: I’ve been very consumed with some family health matters which is why you’ve not heard fro me. Your pleasant, astute and objective analysis has allowed you to view and even tear apart facts. Those facts lead to a certain direction and you have created various models (charts) which detail that direction leaving room for error in the event things turn opposite to your conclusions eg., 1220 gold turns you bearish. I just can’t see how anyone can call that anything less than genuine.
I’m so sorry to hear that Gallo. My thoughts are with you and your family. Thank you for the kind comment. I’m really not looking for sympathy, but I think it can be helpful if posters and readers know a little bit about me, where I’m coming from, and why I visit this site. Wishing you and your loved ones all the very best.
I think most successful investors know you can only make money by sitting, holding an asset class for several years. Looking at gold, I stated on forum in Jan/Feb 2019 we were for a break, but I only sold small positions as I am long term holding as I did before from 2005-2011. Therefore I do believe Northstar work adds value and is consistent in its long term approach. I remember some authors on this forum turning very bearish last week, same happened on Twitter where some authors very turned very bearish (Peter Brandt forecasted gold to hit 1236 and lower). For me it was very obvious we were at crucial times with silver very weak and gold stocks holding well (at least the GDX). Thanks to my own research and work from authors like Northstar and others I was able to notice positive divergences in gold stocks and other positive similarities with previous bull run in gold. I am glad I did not sell any positions as last 2/3 days have been very strong in GDX and it would have been difficult to buy back everything at same level unless you are a trader. (I could have sold 3 months ago but most of my holdings are near similar levels of Feb/March)
Hey NS. I grinned yesterday when PDL said you were talking your book. I found it funny because the only book you have is your own private one–you’re not selling anything to anyone else. So I think that he was obviously making a joke and not a serious statement. Personally, I think it’s great that his position on the dollar is the opposite of yours. Let the games begin!
Also, I think it’s very interesting that we’ll very soon see whether long-term commodity and credit cycles are valid because if they are they’re telling us something very important at this juncture. I find it a fascinating intellectual exercise,at least as much fun as actually making money. I love your stuff, love Norvast’s stuff, and love Fully’s charts which always show when we’ve reached a make or break point. And, I like reading PDL’s elliot wave inputs and dollar take even though it challenges everything I believe to be true. (Fundamentally though, on the topic of the dollar, like Fully, I really don’t care what it does. It doesn’t affect my feelings about PM investing one way or the other.)
Anyway, as you know, there’s really no way to read intent on internet comments. Often stuff sounds sharper than intended. Keep up the great work NS. It’s appreciated.
Hi CT. Like you, I really enjoy the challenge (it’s one reason I went into weather forecasting). It would be boring if it was easy and you could be right every time. Opposing views are really important, and a closed mind can be disastrous with investments. Very true what you say about online comments seeming sharper than intended. I’ve seen it snowball too many times.
Excellent Sir NorthStar
Your motives are obvious to anyone with an open mind.
Thanks for this .
Amen and carry on Northstar!
P.S Maybe I shouldn’t have canceled that monsterbox.
Ha ha, maybe not…
Cheers, Jim.
I hope so Fully. I certainly would never think of trying to sell my ramblings -0 far too much responsibility and pressure. I do hope it’s useful though. It certainly helps me to get things straight in my own head 😉
Thank you Northstar. I always get a bit of a tingle when I see your posts. You’ve been remarkable!
Lol, that’s nice to hear (I think 😉 )
Excellent Post.
“I found it funny because the only book you have is your own private one–you’re not selling anything to anyone else. So I think that he was obviously making a joke and not a serious statement. Personally, I think it’s great that his position on the dollar is the opposite of yours. Let the games begin!”
And yes, I was staking down the opposite side of the fence (longer term) but in that fairly cryptic post … talking your book was indeed meant as a throw away intro.
As for the action, the break above 1330 adds some new wrinkles to the T/A. Now it has to hold. As for the fundys ….
Blain: “In 35 Years Of markets, This Is The Stupidest Moment I’ve Ever Seen”
https://t.co/CvtEosYyET
The denizens of Eccles are Crack Addicts … or their clients are. Or both.
But we knew that.
Agreed Pedro – we need counter-arguments here. It wouldn’t be healthy if we all had exactly the same views.
Northstar, you are one of the rare straight shooters. Always sharing your perspective and rationale, never promoting anything. Excellent work, and always thought provoking. Okay, right now, thought exciting. 🙂
Many thanks Silverboom. Always enjoy reading your view points as well
Northstar, mahalo nui loa from this corner of cyberspace, you are much appreciated so please carry on. A little local weather fact that I observe here is rainfall. Last year I measured 184 inches of rain that fell on my property where as the 10 year mean was 108 inches.
Wow, that’s a lot of rain! Here in NE England, we average about 25 inches per year.
Excellent comments, Northstar.
Thank you Sir.
Yay Northstar!