Is Gold slowly turning into a Bull?
Well, as of right now, we don’t know. However, IF the US Stock Market has finally topped, then I would conclude that gold is indeed most likely in the early stages of a cyclical bull. Conside the following two ratio charts:
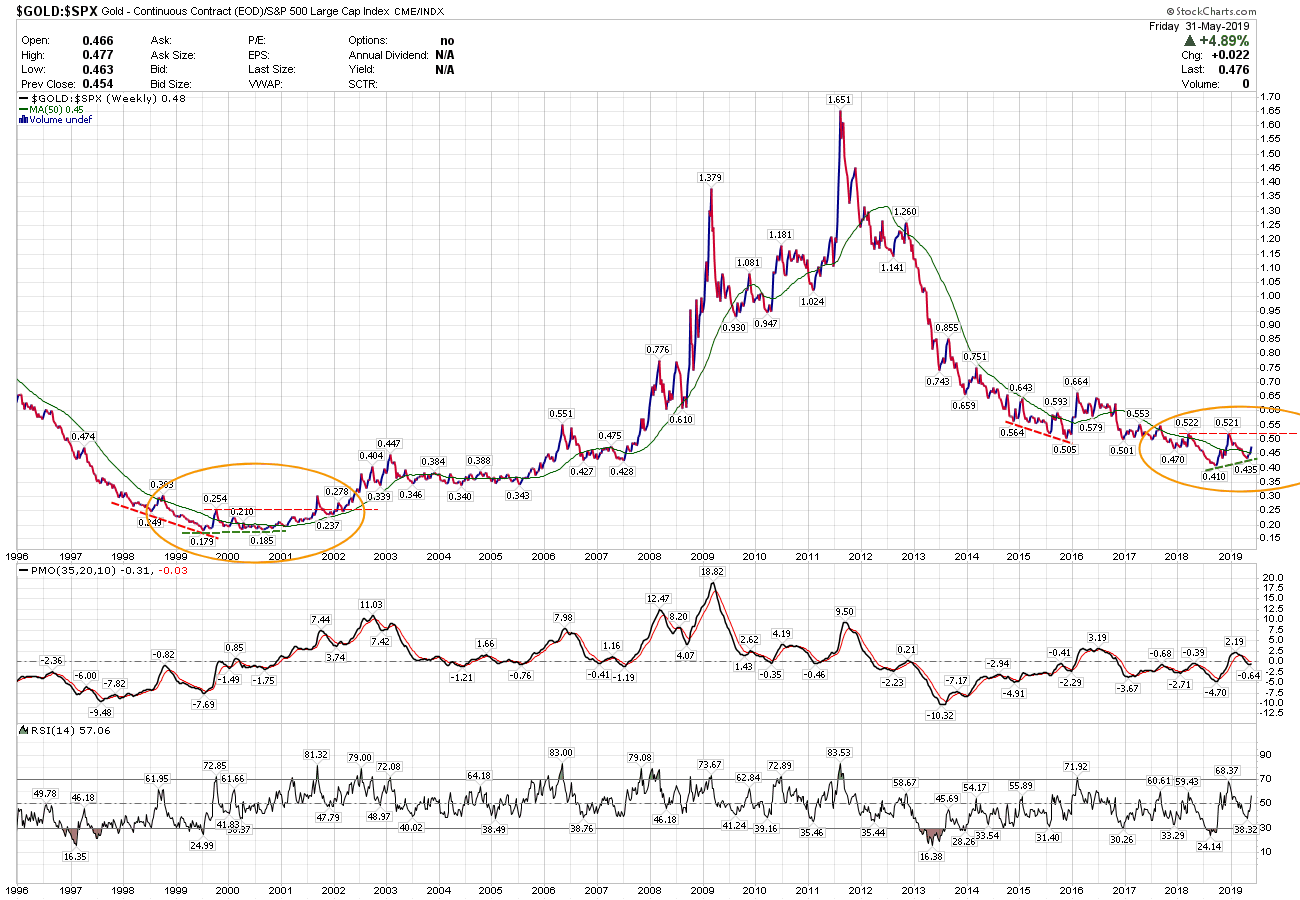
Looking at this Weekly Line Chart of the ratio between Spot Comex Gold and the S & P 500 Index it appears (to me, anyway) that for the first time in the past eight years a higher low has developed. But until this ratio makes a Friday close above .53 it’s only teasing us. Should that happen – and then this chart make a CLOSE above THAT weeks high – I’ll become a believer.
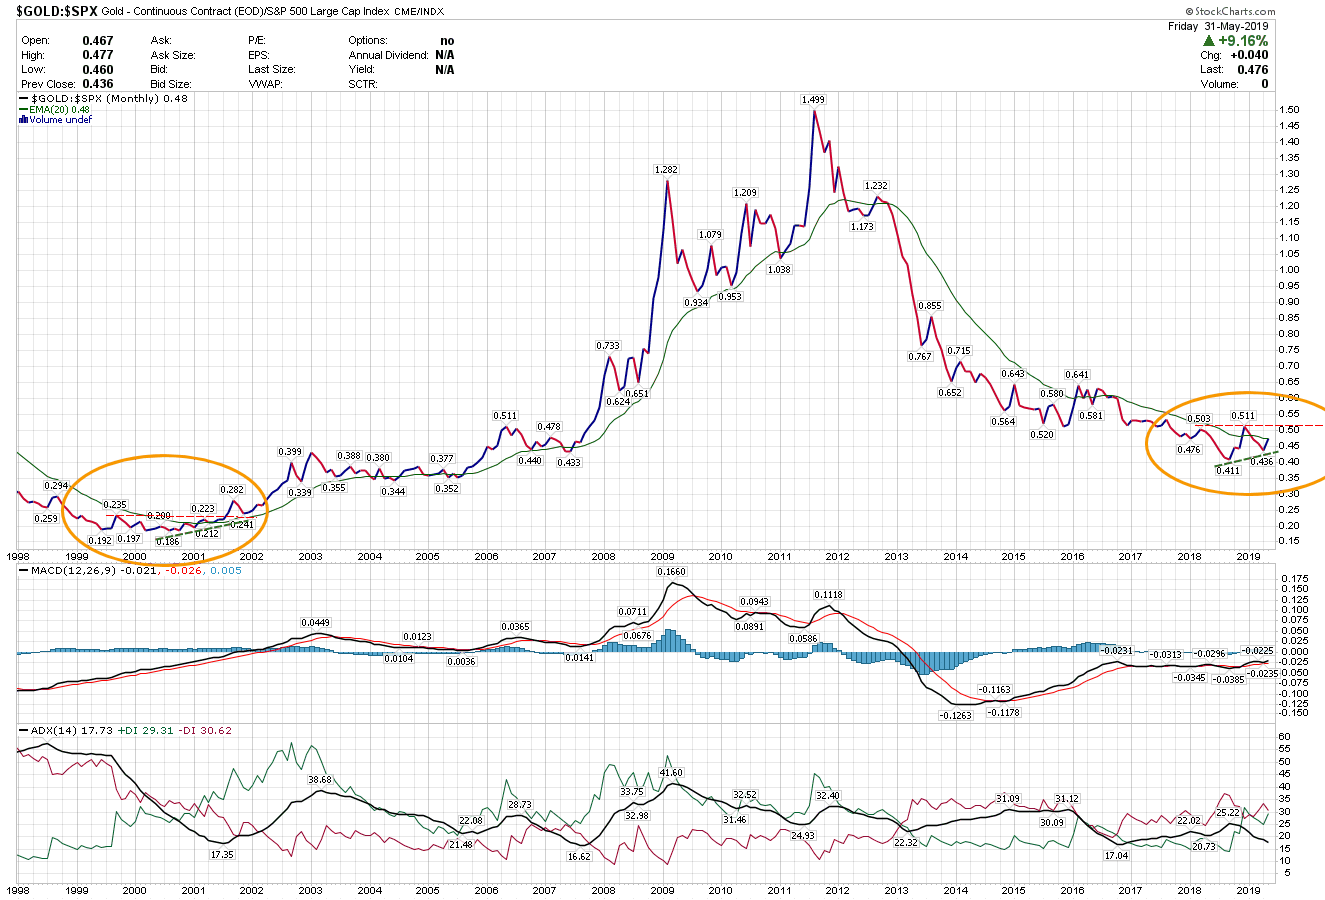
The same can be observed – with the same “proofs” required – on the Monthly Ratio Chart of Spot Comex Gold and the S & P 500 shown below.
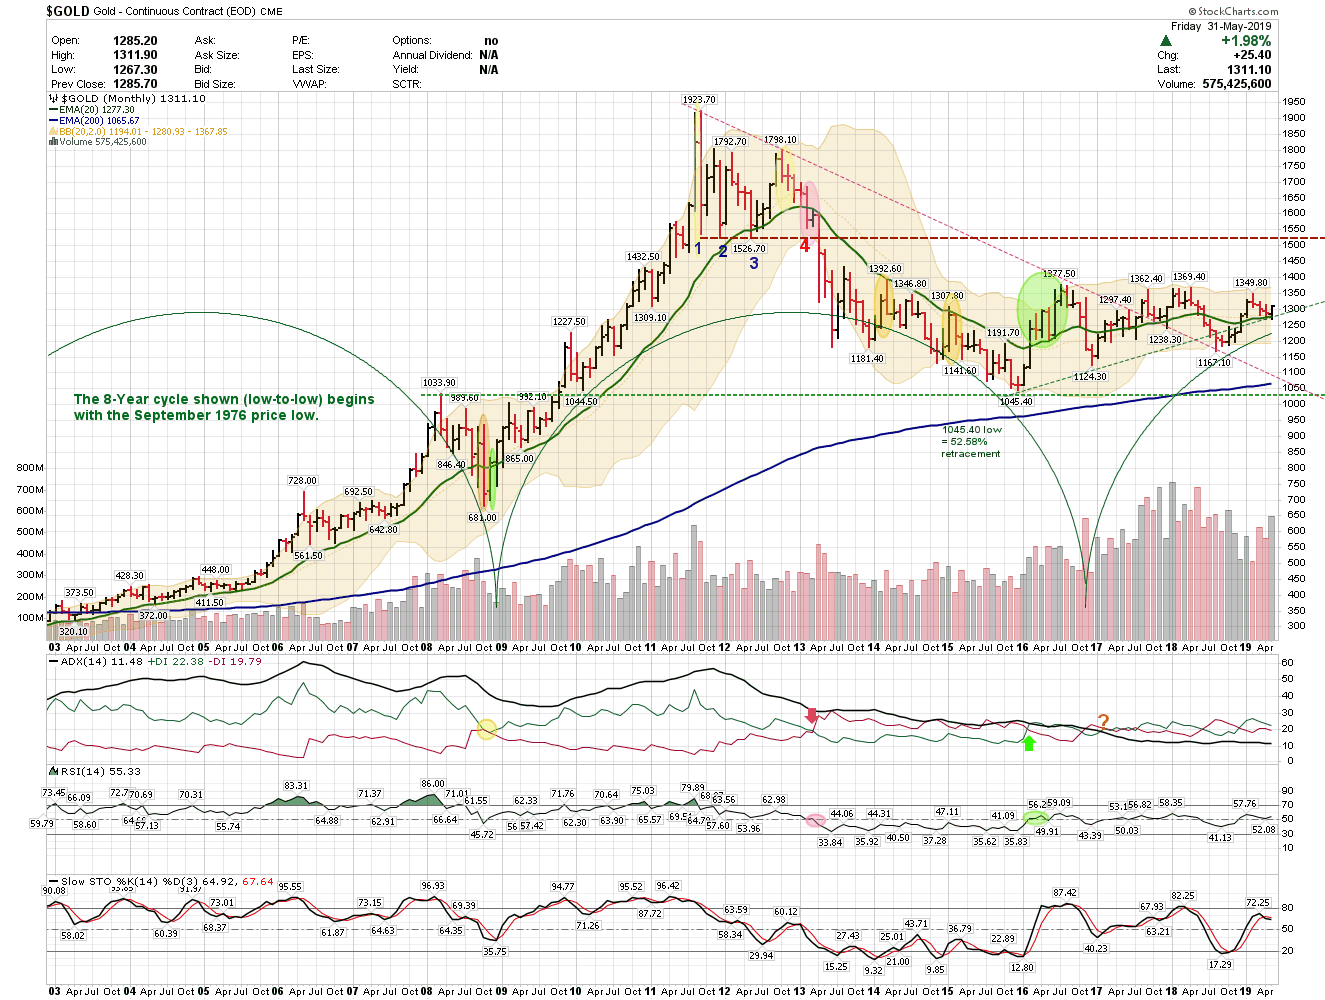
Concerning the Monthly Bar Chart of Spot Comex – it will now take a monthly close below $1,167 for me to give up hope of a near-term bullish outcome.
Thanks Booboo !
Baby steps
Your comment:
“Concerning the Monthly Bar Chart of Spot Comex – it will now take a monthly close below $1,167 for me to give up hope of a near-term bullish outcome.”
AGREED…
I had $1,183 in mind, but you persuaded me of $1,167 .
Peace, success, out P