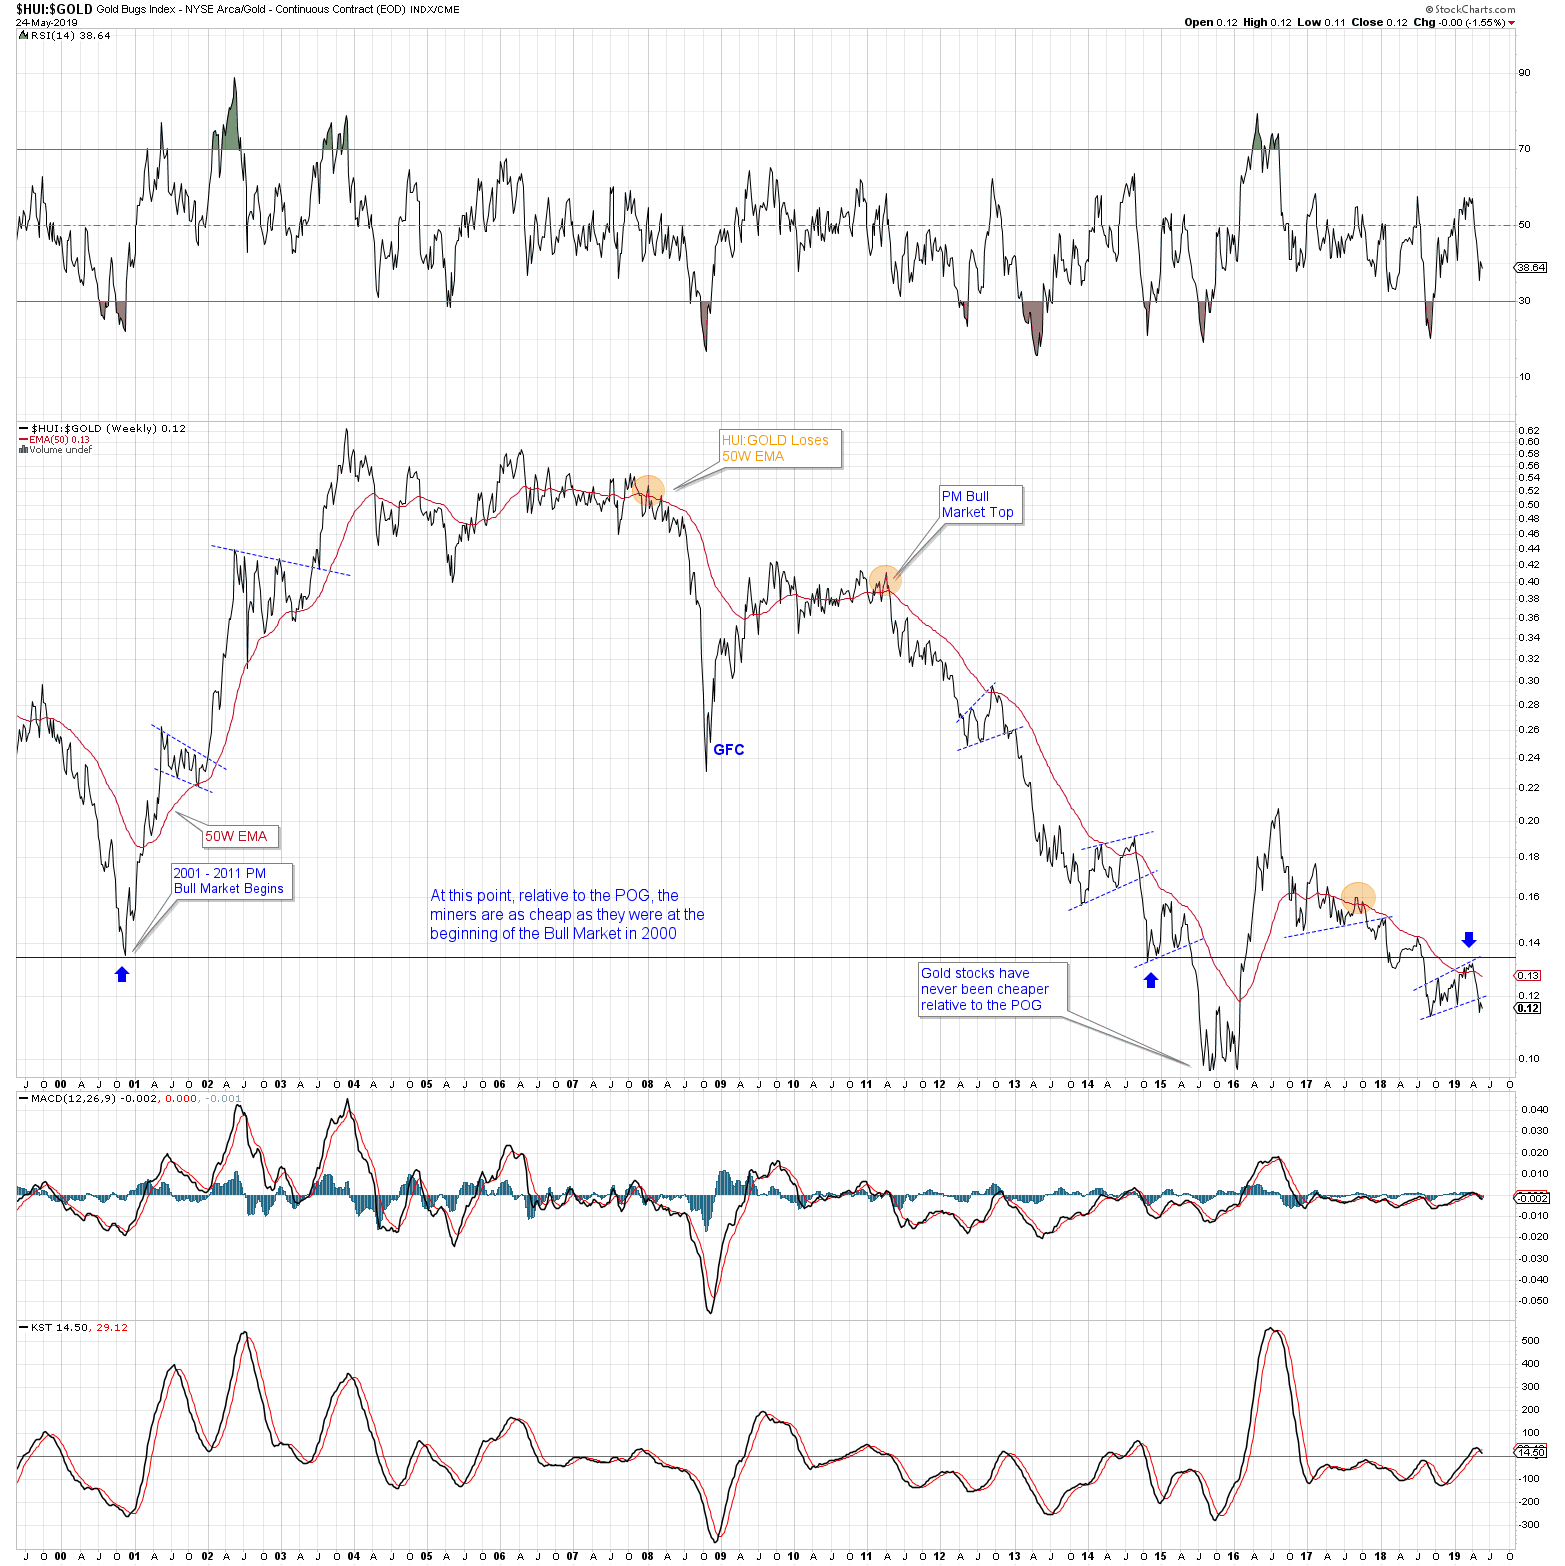
$HUI:$GOLD – A look back to when the 2001 – 2011 PM bull market was born.
Gold has been holding up quite nicely so far. The miners, on the other hand, not so much.
On this longer term chart the recent rally that started last Fall and ended in the Spring is contained within the bear flag apparent in the lower right hand corner.
The HUI:GOLD ratio peaked in late 2004 (on this chart) Did it reach a final bottom in 2016? We don’t know for sure, but one cannot argue that the trend at the moment is down.
One possible scenario:
first – commodity deflation (happening now)
second – the central banks react with massive MMT/QE (under consideration)
third – loss of confidence in fiat currencies as panic buying begins in metals and miners.
I suggest you look at gold price first and then look at miners that have low cash costs (sub 900$ AISC). Forget about the rest as 50% of miners is not making money, but others are. If you do not make money at $1300 gold, better close all your mines!
Great Chart and Great observations Silver Fox .
You should have your own pay site
🙂
sheesh….looks like more down to me…double bottom ?
Thanks for the chart SF.