Interest Rates
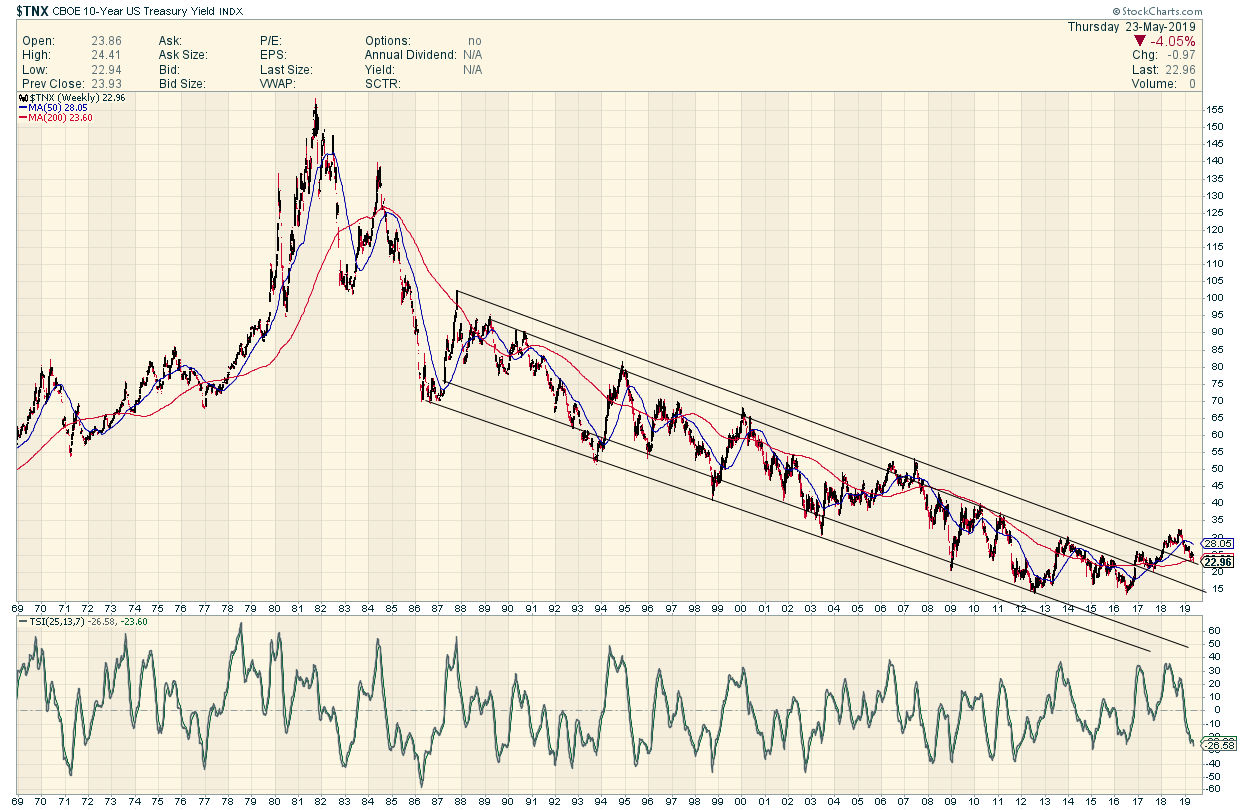
A very Important Chart
We don’t follow the 10 Year US rate here much BUT
It is obviously a very important barometer of where we are and where we are going
I prepared this long term chart a while ago and hadn’t looked at it lately
There was a breakout of an almost 40 YEAR downtrend all thru 2018 …and this year we have arrived at a perfect backtest.
Odds are we bounce here ( also the 200 Week Moving Average)
If Not….we will be looking squarely at a deflationary event IMHO.
Pass the popcorn.
PS….If you believe rates are finally going to rise for a long time…lock in your mortgage right here.
How does this relate to gold lol ?? Can we correlate the two :)!
One Track Mind 🙂
There rally is No correlation between the 10 year yield and Gold…sometimes they march together and sometimes they march to different drummers
Well it’s a pretty chart 🙂
Look at the same chart using log data. You will see no breach of the upper, declining trendline. At least not from 2000 to today.