Just another Test?
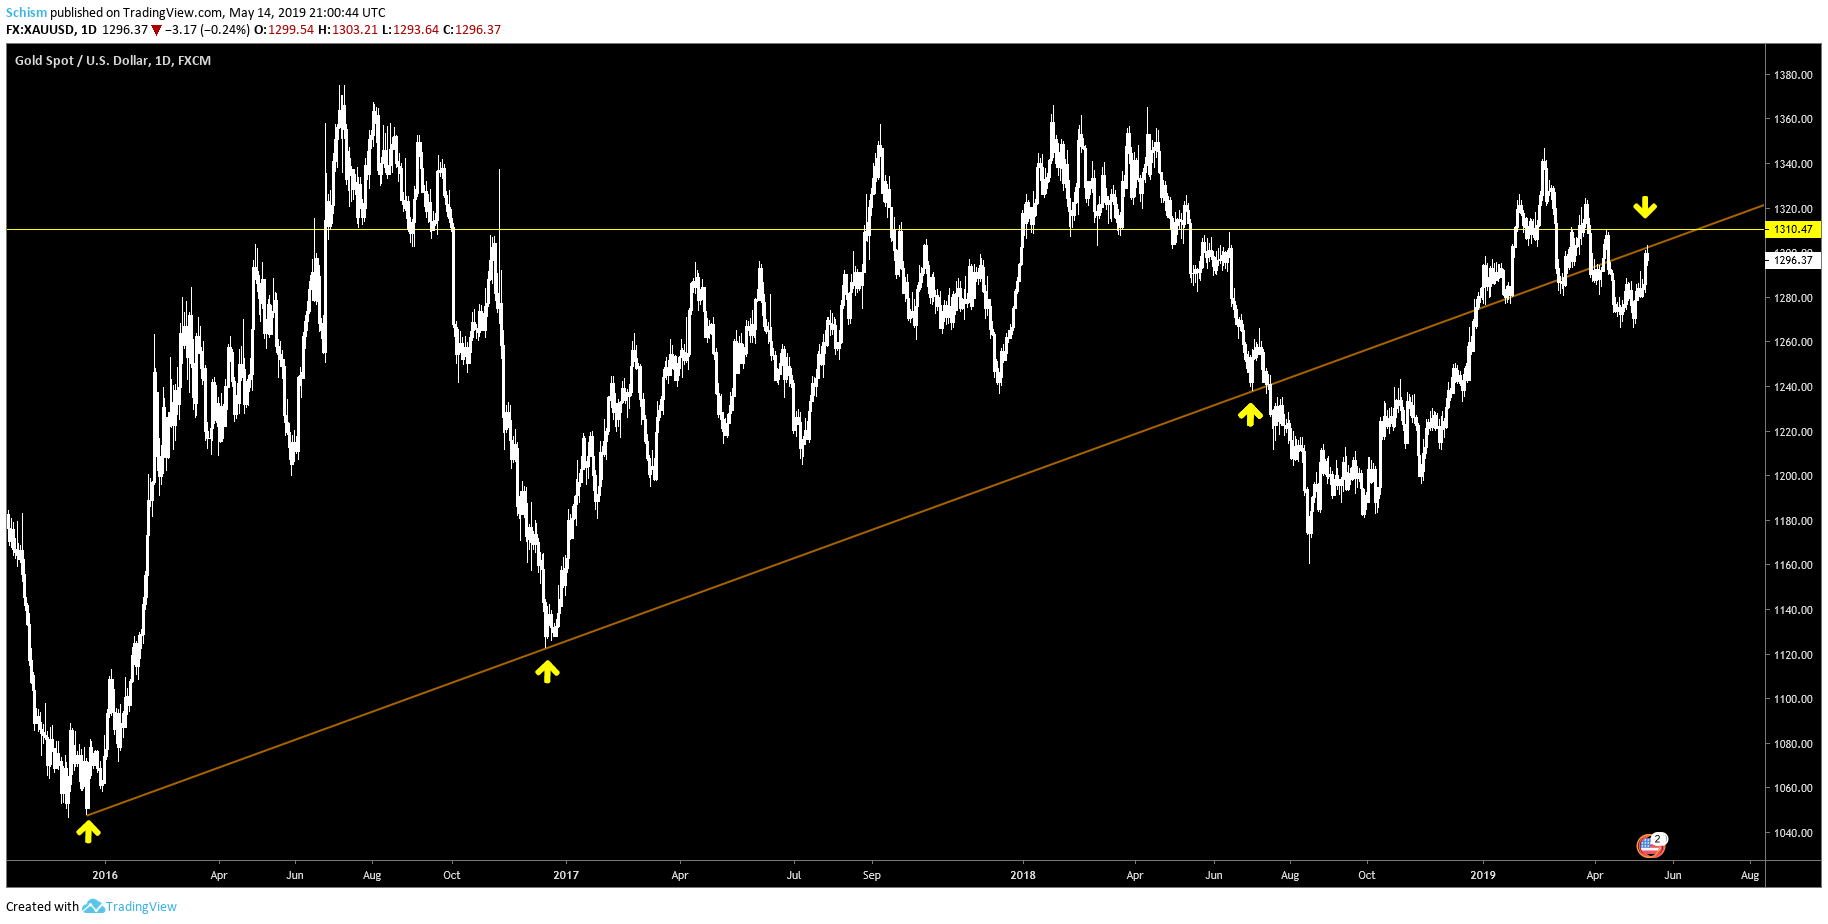
Time will tell if this post ages better than the HS chart I posted earlier this week. But I just can’t shake the bearish vibes just yet. It just seems Gold has been breaking and checking major levels as it goes…is this another example? The HS NL in Gold previously shown is basically from the support of the 2015 uptrend line, albeit a bit sloppy…but frankly most gold tops are a pain in the ass to chart in the beginning. Was this last pop just another check of a rail before it says good bye just like it did to the important 1310 level?
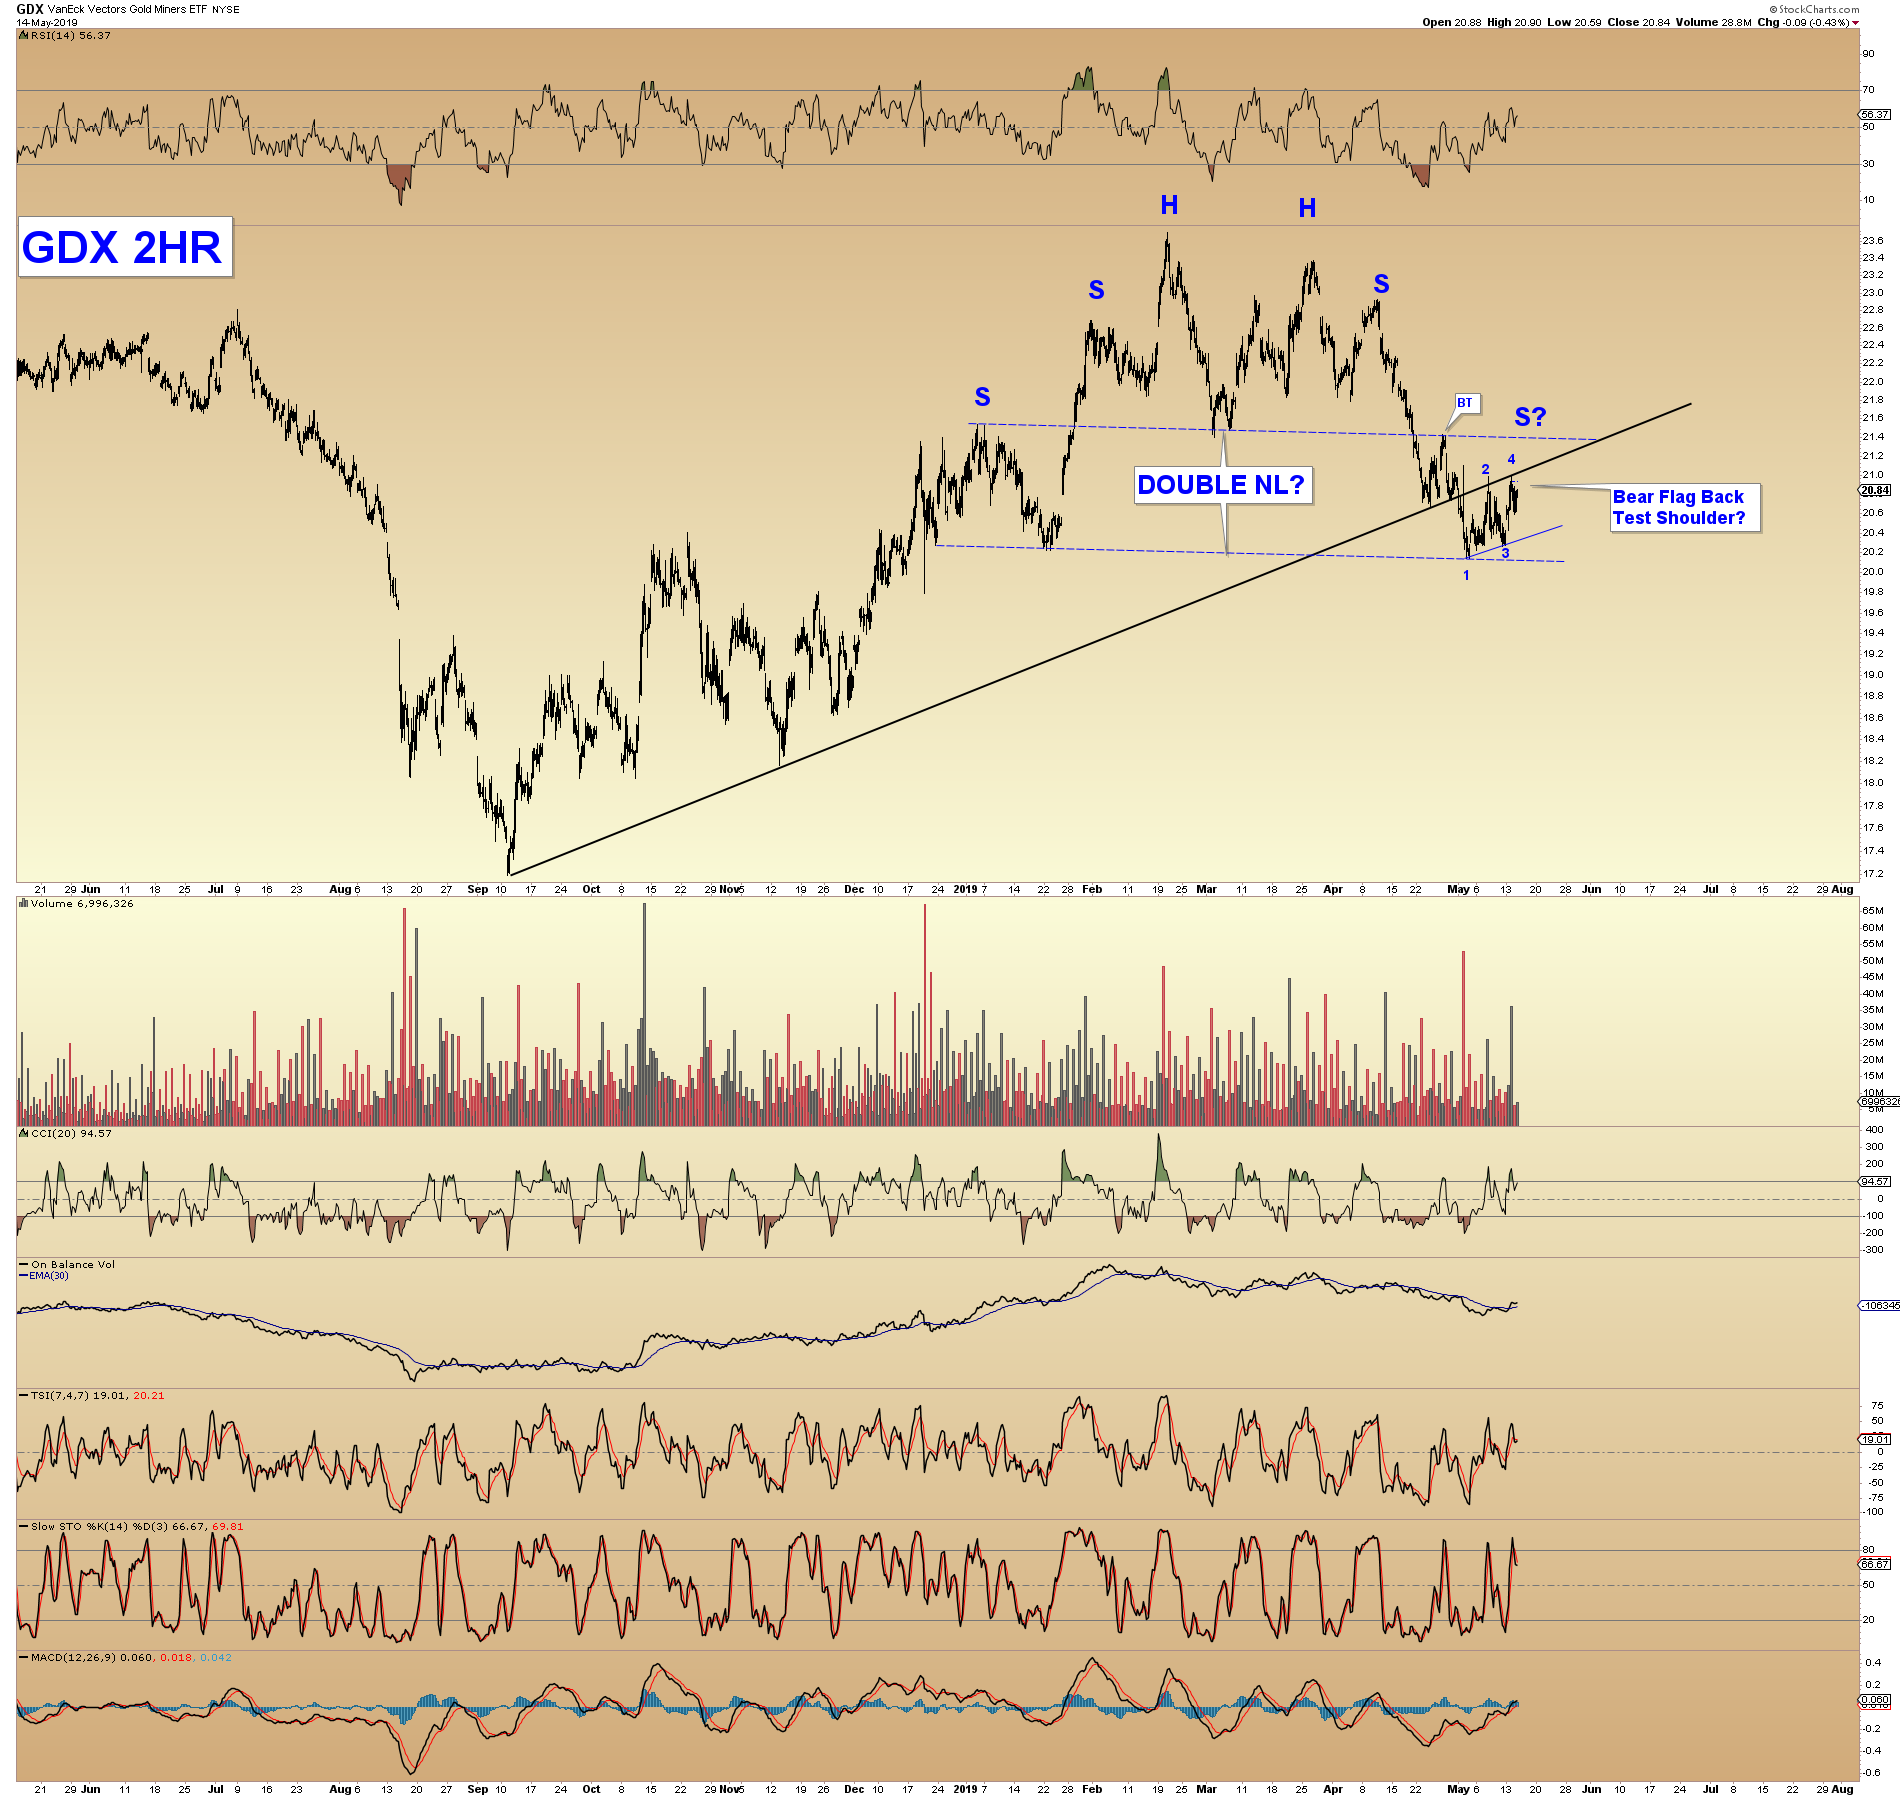
There’s also a possible HS in GDX that looks interesting in it’s current configuration. Get GDX over 21.50 and this scenario will be dead for the time being.
That second chart is a beauty Schism
wow…I haven’t see that …but its very good chartology .
We could build out that right shoulder thru the summer then give it up in october
if the symmetry wants to be even better .
This is a keeper
Things always look a little different under Schism’s Prism
🙂
Thanks Fully…still much to prove but thought it looked worthwhile.
At the moment folks are not listening but IMO gold & miners are acting as a hedge against weakness in stocks.
When stocks bottom (ICL) and advance rapidly into a new weekly cycle then gold will likely top and move lower.
That could come as early as a couple of weeks.
The AUS miners have performed very well over the last 2 weeks but have “gaped” higher and from my experience those “gaps” will get filled – and most of them are at considerably lower prices than current.