Healthy Price Action In Gold (So Far)
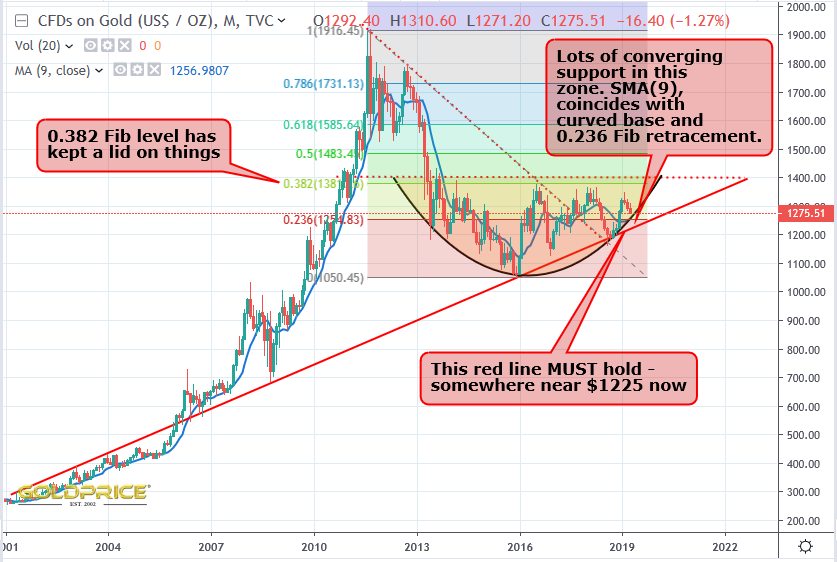
I first posted the ‘curved base’ chart pattern in September/October last year, and it’s been developing and building out ever since. The pattern is still valid though. There are a couple of very definitive statements that you can make at this point #1 We are in a very long term gold bull market until/unless the red line on my chart is broken to the downside (currently somewhere near $1225) #2 All this recent price action is just ‘noise’ – the real bull market case isn’t proven until we break above huge overhead resistance between $1360 and $1400.
It looks to me that we need to go lower to complete this move and have a shot at that breakout. I’m confident my red line will hold. It goes without saying that if it doesn’t we can forget PMs for a very long time. Those that have been saying gold is going to go sideways to down for years to come will only be proven right if the curved base and wedge patterns in my chart fail to the downside. Until then (or an upside breakout), neither the bulls nor the bears can declare victory.
Look at the support immediately below where we are now. Take a look at those Fib levels. If you set the ‘1’ level at the $1900 top, and zero at the $1050 low, you can see significant price action at every Fib retracement level. The lid on our curved base is provided by the 0.382 Fib level. The next one down (0.236) is just above $1250 and pretty much right on the curved base support. The default moving average on goldprice.com charting software on this monthly view is 9-periods. It seems to have provided some very good support in the last main bull phase, pre-2011 and in each ‘up leg’ since 2016. This is also just above $1250. Coincidence ? Below all of that, and a possible target for any ‘spike lows’ is my FINAL RED LINE. It’s time to sit back and watch the market reveal itself – nothing we can do but wait. Have a wonderful Easter everyone.