$XAU Daily – Two Diabolically Different Interpretations.
Ah, the horns of a dilemma…
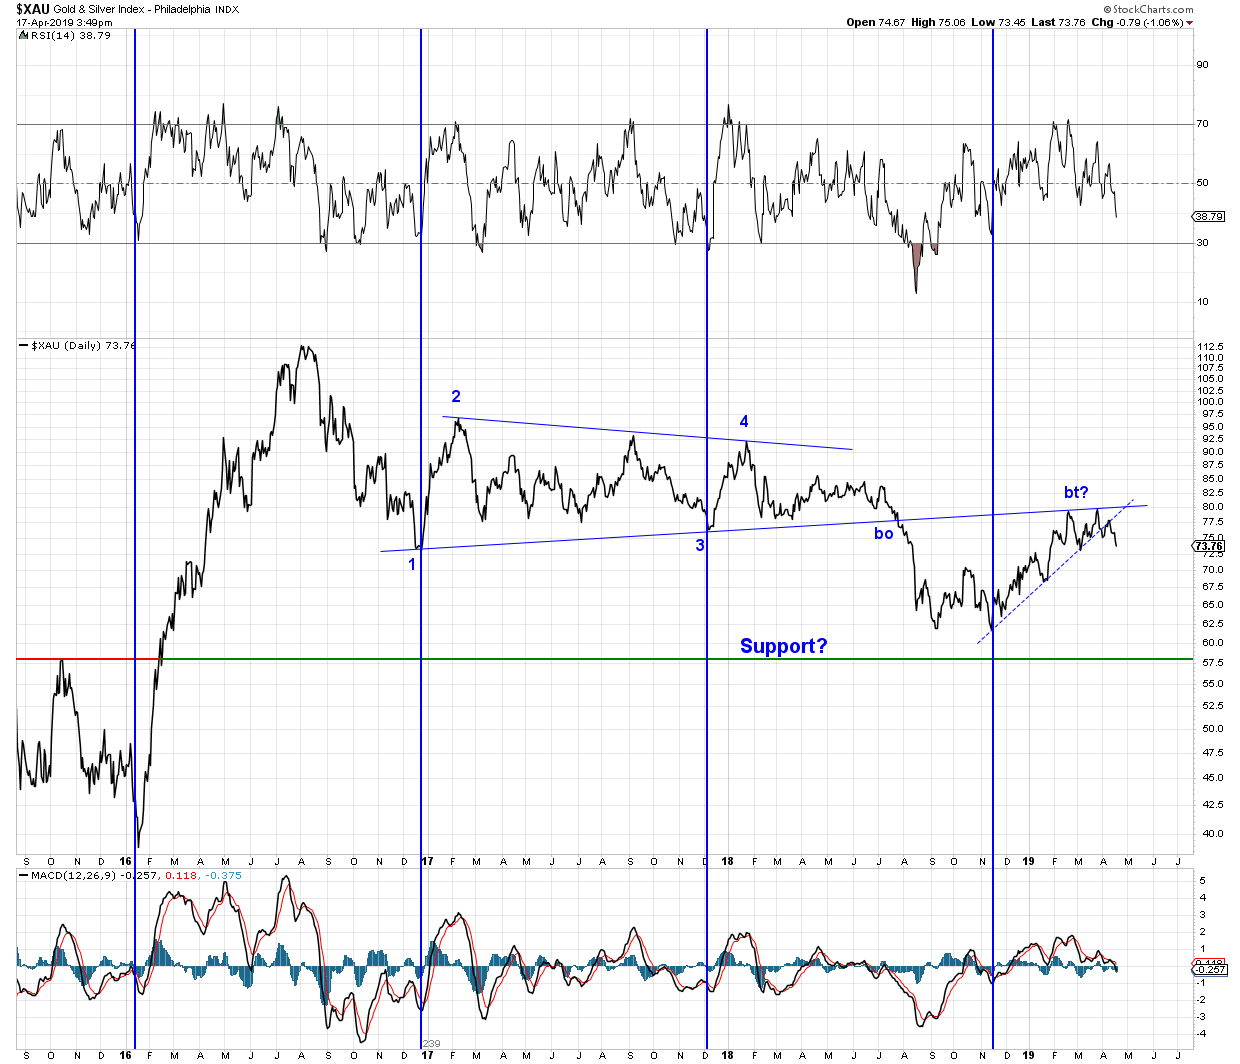
First the bearish case. This chart was posted a few days ago, but to refresh memories here it is again.
On this daily line chart $XAU is back testing a consolidation triangle and getting ready to descend into a yearly cycle low.
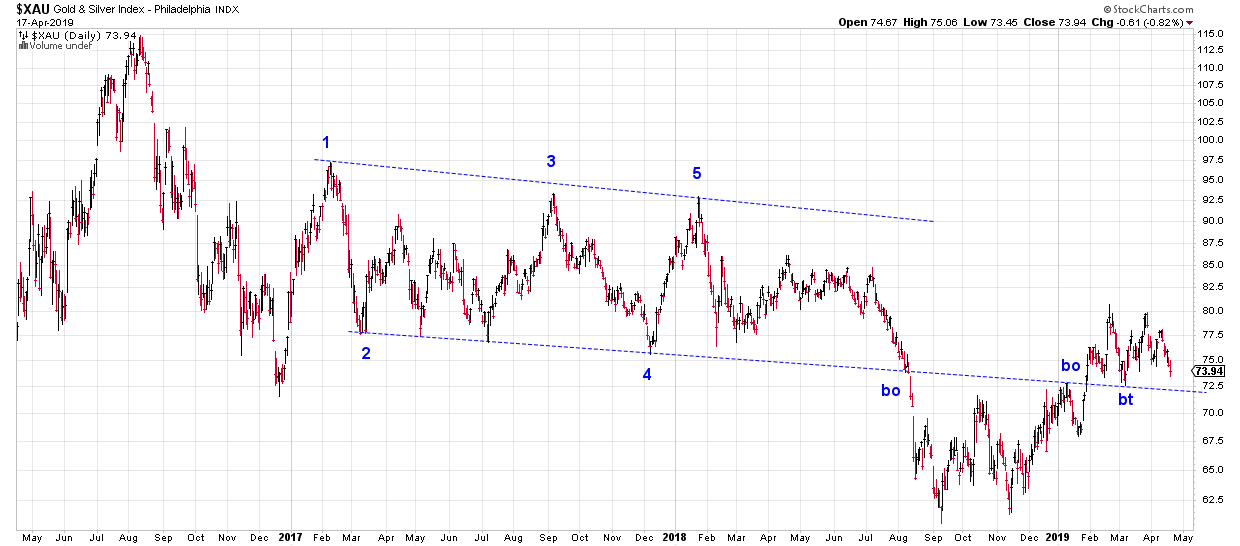
Is it all in how you draw the lines? On this daily chart the trend lines are redrawn to present a bullish scenario. Here $XAU has re-entered the old channel and is building a possible bull flag on the bottom trend line. That is very bullish indeed if it holds.
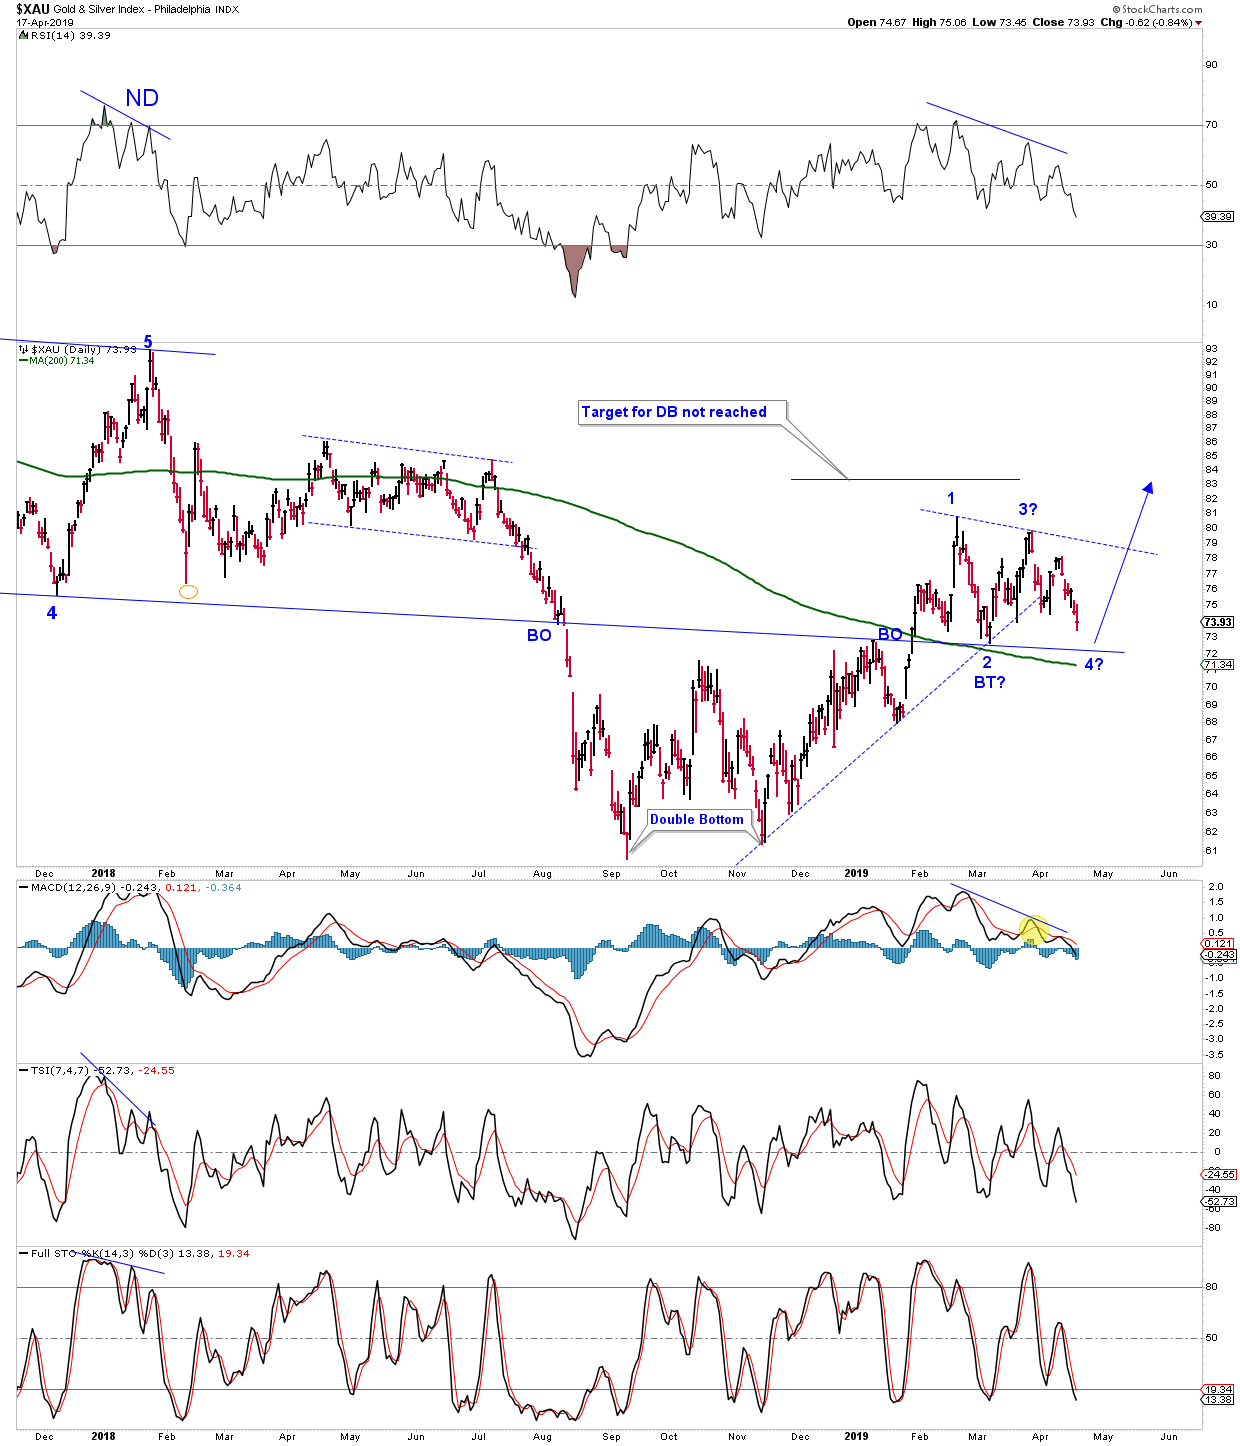
Here is a closer look the above chart. Bottom line – The miners have not yet completely broken down. They are at an inflection point and in the short term can break either way. IMO its time to stay focused, stay sharp, until this dilemma is resolved.
Great Charts Foxy.
This is still the only one that matters to me.
https://www.tradingview.com/x/U9FynWAz/
Nice and clean! Thx
Look at that long term declining trend line ! Hit after hit for almost 8 years and it remains impenetrable. And look where the February challenge occurred – right at the intersection of the two blue resistance lines. Can’t argue with that chart. The miners are trending down. There is faint hope, it seems, for a continuation of the rally.
I guess the clincher could be the weekly CCI (20) coming off an overbought position. Once it breaks down like that it just doesn’t return to overbought without first dropping to or below the minus 100 line. That would take $XAU down to at least 65 before staging another attempt – if there is in fact to be another attempt in the near future.
Good chart, Schism.
This is a great example of how important it is to consider all factors – where are we in the cycle ? are strength/momentum building or declining ? how do things look in related markets (Dollar/rates/equities etc) ? fundamentals ? current economic policies ? You can’t give an accurate weather forecast by considering just the wind direction, you need to be able to predict wind speed, humidity, air temperature, dew-point, ocean currents and temperatures and dozens more factors, not just at your location but at every level up through the atmosphere to the edge of space, and at every point on the Earth surface and in its atmosphere. It’s the same here. A prediction for the future has a much greater chance of being correct if it factors in every single possible variable. That’s impossible of course, but the theory is valid – the less you take into account the less likely your forecast is to be correct. That’s why I post multiple charts from multiple markets to support my thesis, whilst at the same time acknowledging the alternative possibilities and monitoring (in the case of PMs) the downside target and line of ‘final support’.
Impressive Analogy Northstar