Gold – KISs
Keep It Simple (stupid).
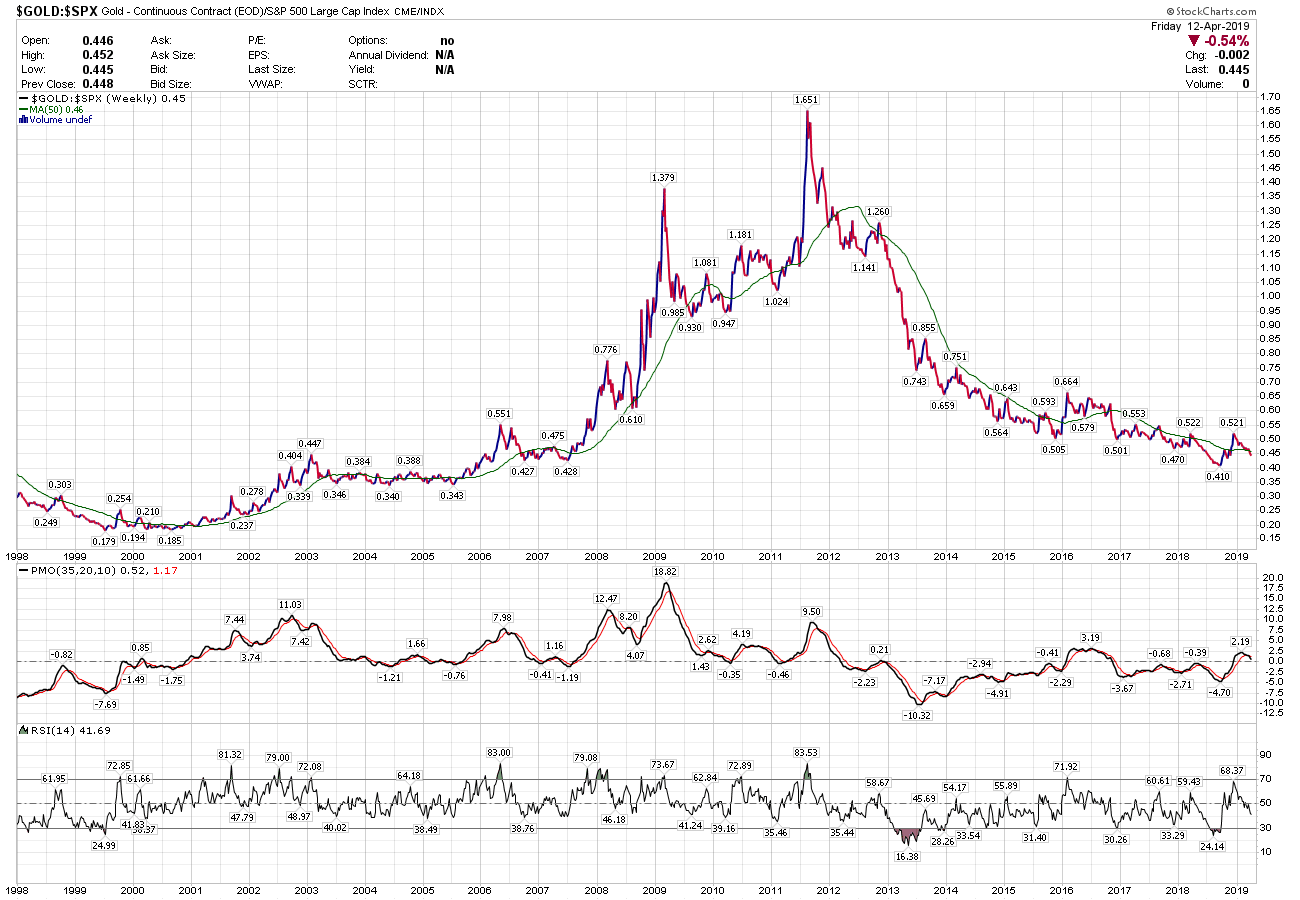
Let’s look at this in the simplest terms: according to this [almost] infallible ratio chart Gold is not in a Bull Market. Period. And that won’t change until these two ratio charts change.
Now for the not so bad news: it’s my opinion that the likelyhood of Gold closing below $1045 per ounce is slim to none – and Slim has already left the bar. While I’m predominately a technician, I don’t completely ignore the “funnymentals”. The world is a far different place than is was in the 1980s and 1990s. The US Dollar has nowhere near the foundational strength it once had and the US economy certainly doesn’t. The country is politically polarized to a degree not seen since 1861. The 1960s look almost tame compared to the present. Next year’s election makes it even harder for me to see a continuing bullish outcome for the US Dollar.
The ONLY way I see Gold at $800 per ounce is (1) the United States enters a deep deflationary recession/depression, and (2) our “friends” at the Fed lose control without creating many multiple Trillions of “dollars” and buying up everything from bonds to stocks to REITs to used autos. I put the odds of them standing aside while the entire capital market seizes up as pretty close to zero.
Could I be wrong? It sure won’t be the first time. I suppose Jeremy Grantham could be wrong (although he called the Bear Markets of 2001-03 and 2008-09) and the S & P 500 continue to chug right along to 3,000 then 3,500 then 4,000 and on and on while interest rates remain repressed and half the country waites tables. While Grantham sees no crash he does see the S & P 500 slowly, slowly deflating over a decade as a rerun of the NIKKEI from 1989-2003.
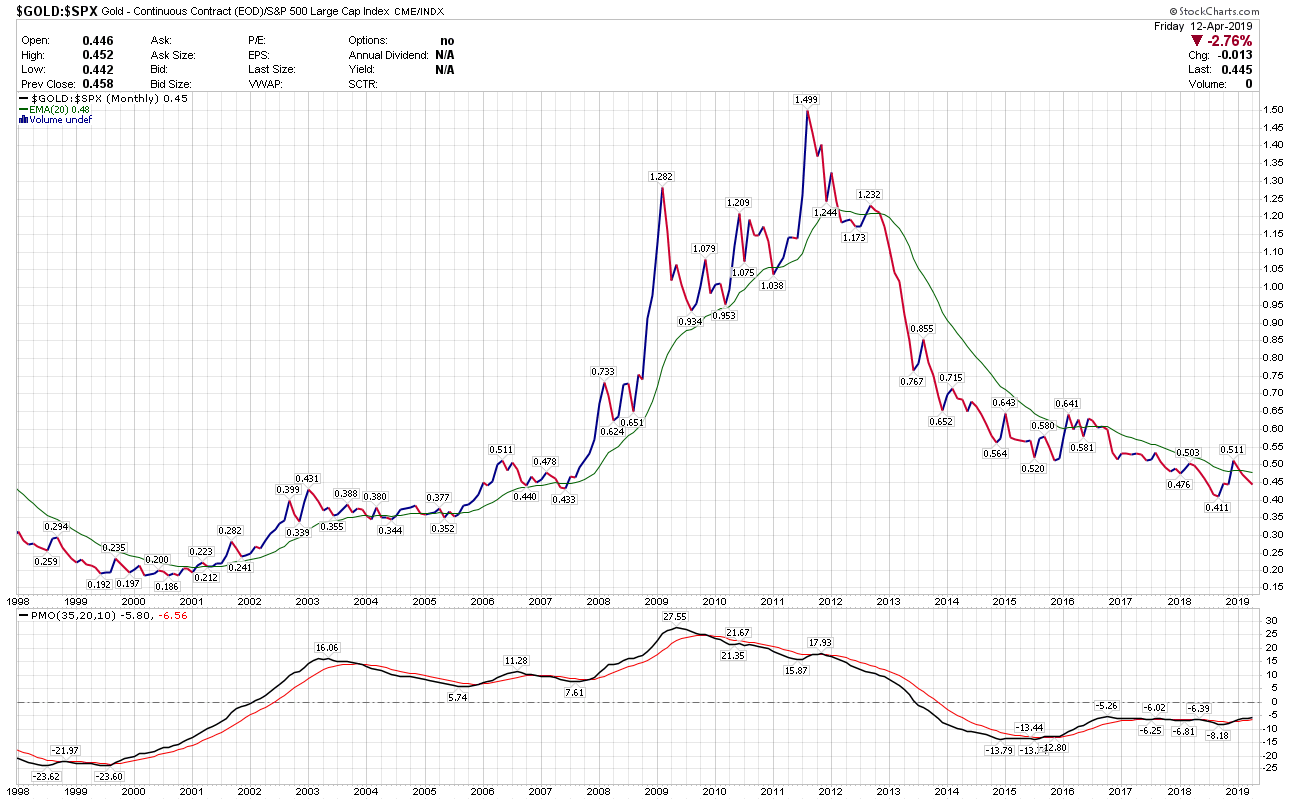
Back to the charts: the 20-month EMA is still above the 200-month EMA, and hasn’t been below it since the Great Gold Bear ended in 1999-2003. However, the turn to the upside could possibly be two to five more years coming.
Ugh!

I think we need to change your handle
Boo Hoo Man
I hope not! Rambus is FAR better than me (and most others) at making Long-Term calls. He’s at least cautiously optimistic unless I’ve missed something so I’m hoping he’s right.
On the last chart (Gold Monthly bars) the TSI is at least above the zero line and so is the PMO, but just barely.
The downtrend line from the 2011 top has clearly been broken with support showing up in October and December 2017 as well as August 2018 precisely where it should have – on the extension of the aforementioned downtrend line.
But all this only tells me that Gold remains in a $230 sideways trend channel between approximately $1,167 and $1,396. Until that’s broken to the upside gold is a buy near that channel low (when oversold) and a sell at the Rambus’ Neckline (when overbought).
Let’s hope for price action that makes Rambus turn unequivocally bullish.