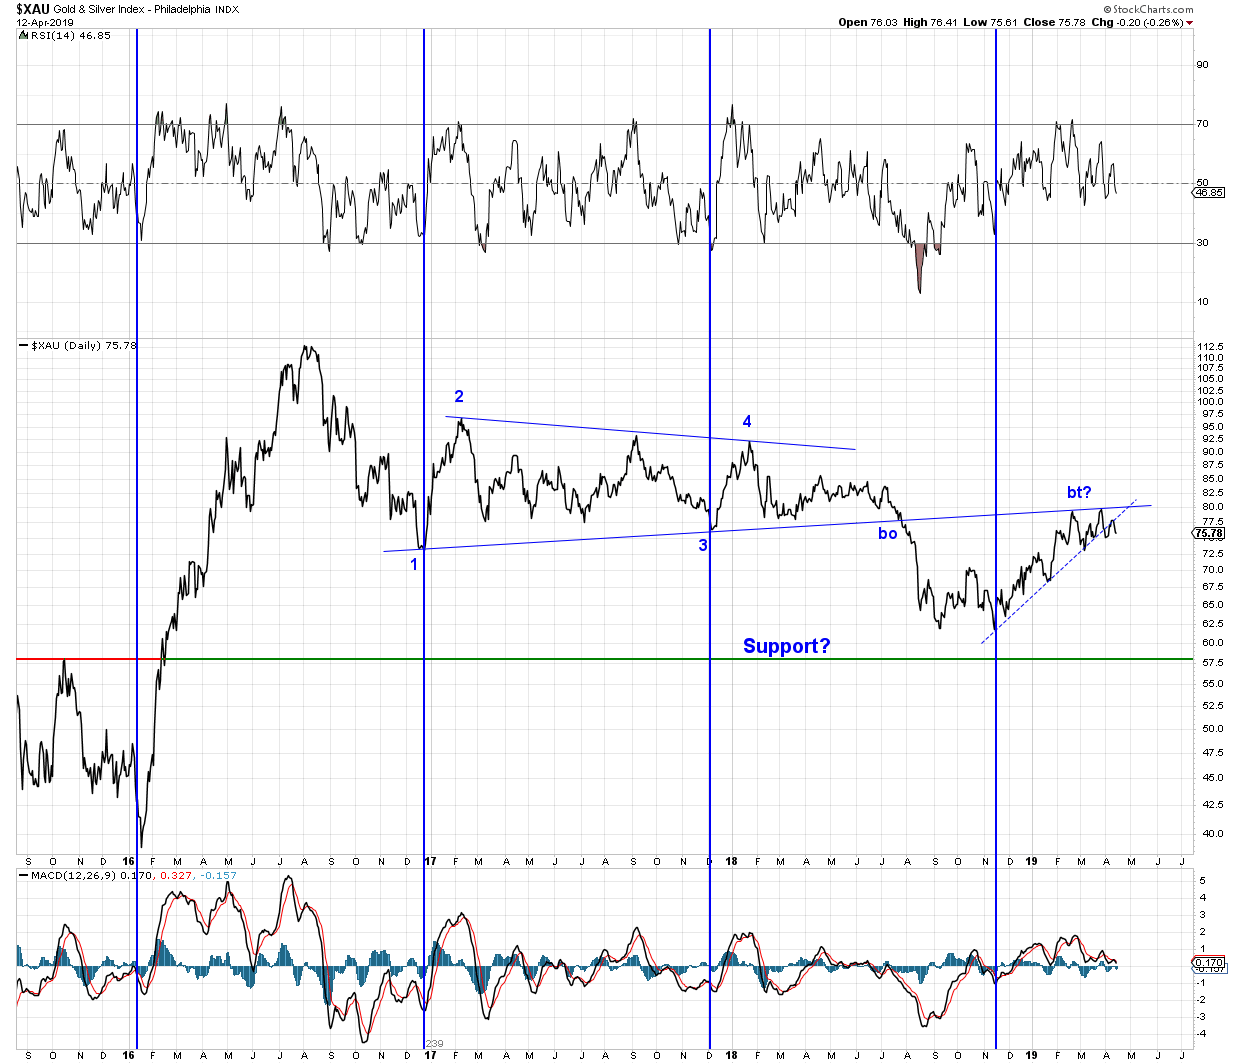
$XAU – Daily
Here is the $XAU daily line chart with cycle lines. The cycle bottoms are 50 weeks apart, near enough.
If there is to be another cycle bottom in the same time frame it will occur in October 2019. Should that happen, will it be a higher low, a lower low, or about the same level as last November? If we only knew!
What is interesting is that the October time frame is a match for a SM peak on the chart by Sven Henrich (SF previous post) where three long term trend lines are shown to converge. So SM down, Gold up – come next October ?
Nah, couldn’t happen. Could it?
Sir Fox
That’s a great chart
But pretty depressing if you ask me.
Nice to put a positive spin on it but it shows a rather weak bounce at the cycle low and now rolling over and all downhill the rest of this year
Twas just a backtest after all
sheesh
Thanks for the positive feed back, Fully. Truth be told, I am bearish, but uncomfortably so. I won’t be complacent until all three PM indexes($XAU, $GDM, $HUI) are sporting a bearish MACD cross on the weekly charts. GDX and GDXJ too.
I’m itching as much as anyone for the rally to continue, but to me the charts are saying hold clear for now.
You are correct about October fox. I have week of October 14th as market wide event. I expect a shift in oct that last into the 2020 election or inauguration. Will send some you corroborating evidence that ties into what you are seeing. Dont have time to post it now…but you might find interesting.