Golds Impressive Chartology
The more I’ve been looking at this over the last few days, the more it amazes me. It’s almost too perfect.
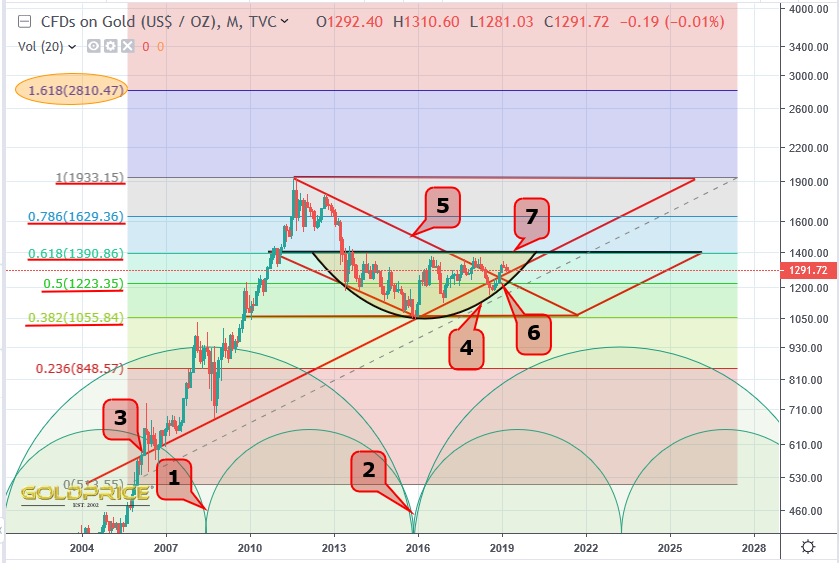
1 – 2008 – Golds 8 year cycle low embedded in the middle of the 16 year cycle
2 – 2016 – Golds 16 year cycle low
3 – The support/resistance line from recent price action connects back to important support which was established between 2006 and 2008 (on this log chart).
4 – Perfect curved basing support centred above the 16 year cycle low (a repeat of the pattern at the start of the bull market in the early 2000’s).
5 – Resistance line drawn from the topping pattern in 2011 and 2012.
6 – False breakdown flowed by an ‘around the apex’ breakout (rising support in the $1275-$1280 region).
7 – Horizontal resistance.
Just look at those Fib retracement levels ! If that’s not perfection, I don’t know what is – 0.382 Fib retracement equates to $1055. The 0.618 level is just below $1400. A move above $1400 would set up a target somewhere just above $1600, which fits in with some of the other work/methods I’ve been looking at. Also very interesting is the level above that – $2810. Time is the missing piece of this puzzle. I know where the cycles are. I know where price is now, and I know the target areas. It’s just a case of when. If you’re a gold bear, you’d be eyeing that 0.236 Fib level at $848 of course. As you know, I’m not bearish at this point in the cycle, but a break below $1223 and I would throw in the towel.
Rather arbitrary fib placement no? I dont get the starting point..but maybe im missing something.
I’m just using the Fib levels ‘backwards’, using the 2016 peak as the starting point, and working in reverse. Less of a forecast, more of a ‘hindcast’. I just thought it was fascinating how the numbers line up.
Interesting. But Fib differs with other author: sees 2073$, 2681$ next
http://www.marketoracle.co.uk/Article64442.html
My view is that Mr. Market KNOWs all about this, and how everyone is following the charts, and therefore Mr. Market is going to do the Exact opposite of what the charts are all saying is going to happen.
Maybe, but that’s what many said in 2008, however the cycles won the day and we went on to new highs in 2016.