Sticking With The Facts…
…here are some downside levels to watch.
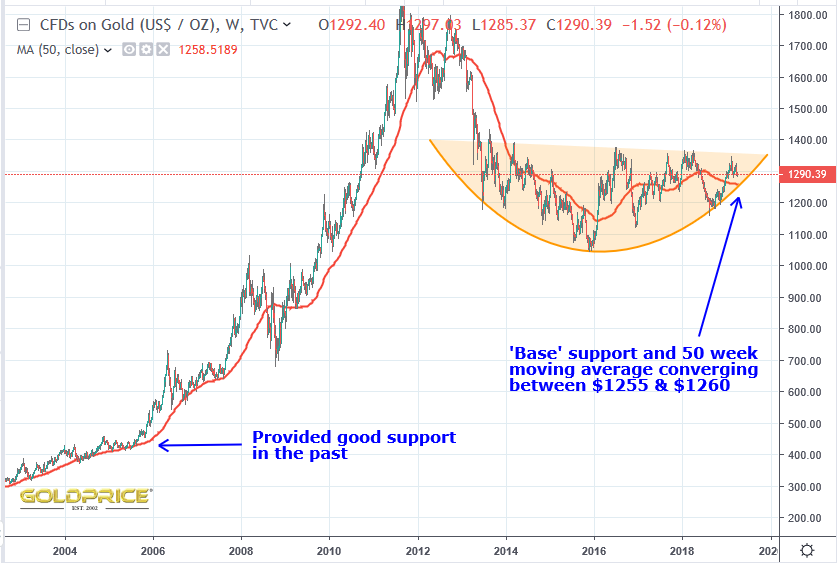
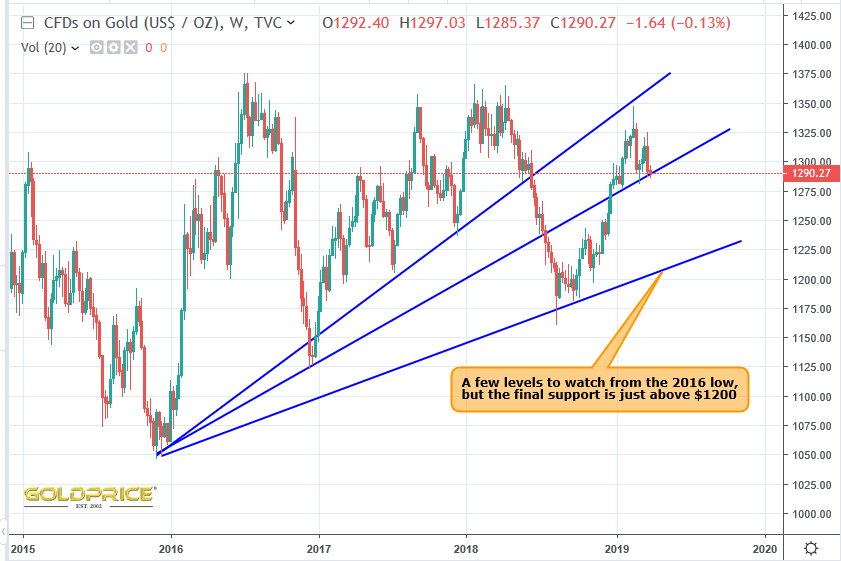
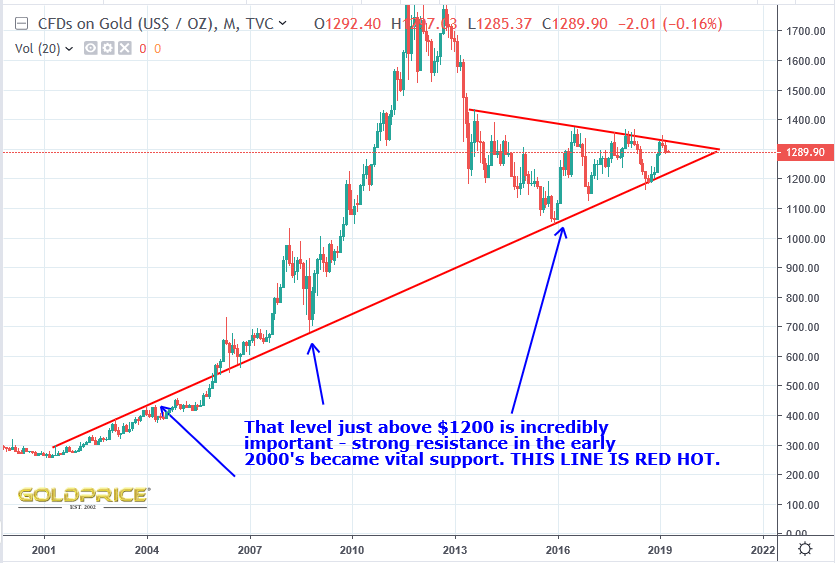
I strongly suspect that $1255-$1260 will hold (maybe a quick spike below that). The first chart even gives a possible target time for a breakout, because the moving average crosses the curved ‘bowl’ support line in 2-3 weeks time (depending how you draw it). Could that be a ‘target’ we need to hit and bounce off ? Very important is that ‘red hot’ line on my last 2 charts, just above $1200 – it’s clearly of vital importance. It’s been pivotal to price action for nearly 20 years. A break below that would be a disaster in my view. I say that, not because I’m expecting it (I’m not), but because an enquiring mind considers every possibility, no matter how small, and prepares accordingly.
Nice charts, my concern is not if downside is 1260 or 1280, but what’s next? Will we just revisit the $1350 highs or will we make newer highs to maybe $1400?
The more important question however is what will happen with gold stocks as from watching gold stocks charts enthusiasm is not there!
Maybe we just reach GDX 25 on next rally and will that be the high of the first rally wave since last August and will we consolidate next for some longer time. Just a thought.
Hi Alex. GDX and PM stocks generally are at a very low level in comparison to the price of gold. However, I don’t think much is going to happen until/unless we break $1400 convincingly. At that point I’d expect some very rapid gains. My work is strongly suggestive of a breakout this year, although many remain to be convinced. Wall of worry ?
Great thoughts Northstar … Sid Nelson’s Elliot Wave/Hurst Cycle work aligns with this view and so does Michael Olivers work, so does this guy: https://www.thegoldandoilguy.com/ if you read his articles. Interestingly, they all use different tools to come to the same conclusions. I find that convincing. The fact there are so many on this site that turned bearish all of sudden tells me a bull market is right in front of us. What’s interesting is we rallied almost $200 of last summer lows, so some healthy retracement should be expected this time of year. Patience is a virtue.
Absolutely right Afasilver. Some pullback and consolidation is a very good thing at this point.
The new poll Fullyputoutshows that the overwhelming majority are actually bullish.
Yes, but a clear mood swing has changed over the last few days … same with Rambus (he sold all his miners today). However, the people I’m following noted above remain very bullish … I still believe it’s just a matter of time until gold breaks the 5-year neckline, regardless of what manipulation exists in the market. The American economy is on debt-soaked life support … actually it’s a heroine addict and the FED continues to provide it the necessary drugs to survive … pretty embarrassing.
great charts!!
Pullback to 1260 1280 is in the cards. Should not break 1160. If it does than gold is going much lower in Elliott wave C. Fingers crossed.
Thanks. I really hope we don’t see $1160 !