My View
As some here remember, I have Elliott wave software that I run from time to time on the markets. No system is perfect, but I like Elliott Waves and have done well with them over the years.
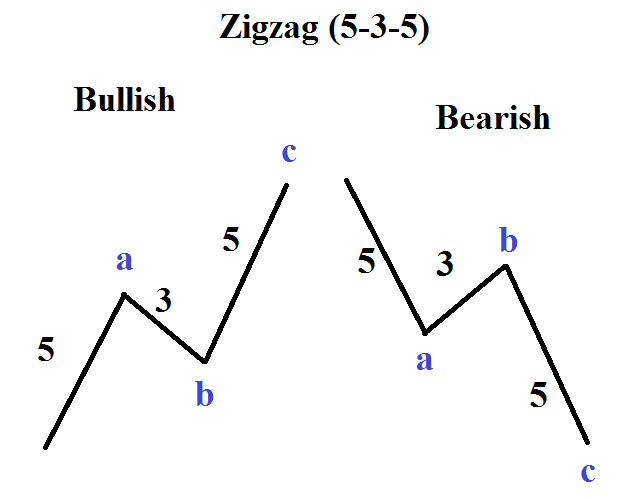
First, a basic tenet of EW is that you are either in an impulse move, or a correction. I think few would argue that gold was in an impulse move from 2002-2011. After an impulse wave, a corrective wave follows – which is where we are now. Corrective waves are usually 3 distinct waves. There are others, but they don’t apply to the following charts. In our case that means a leg down, a leg up, and another leg down. Here is a sample corrective wave.
Now on to the EW charts –
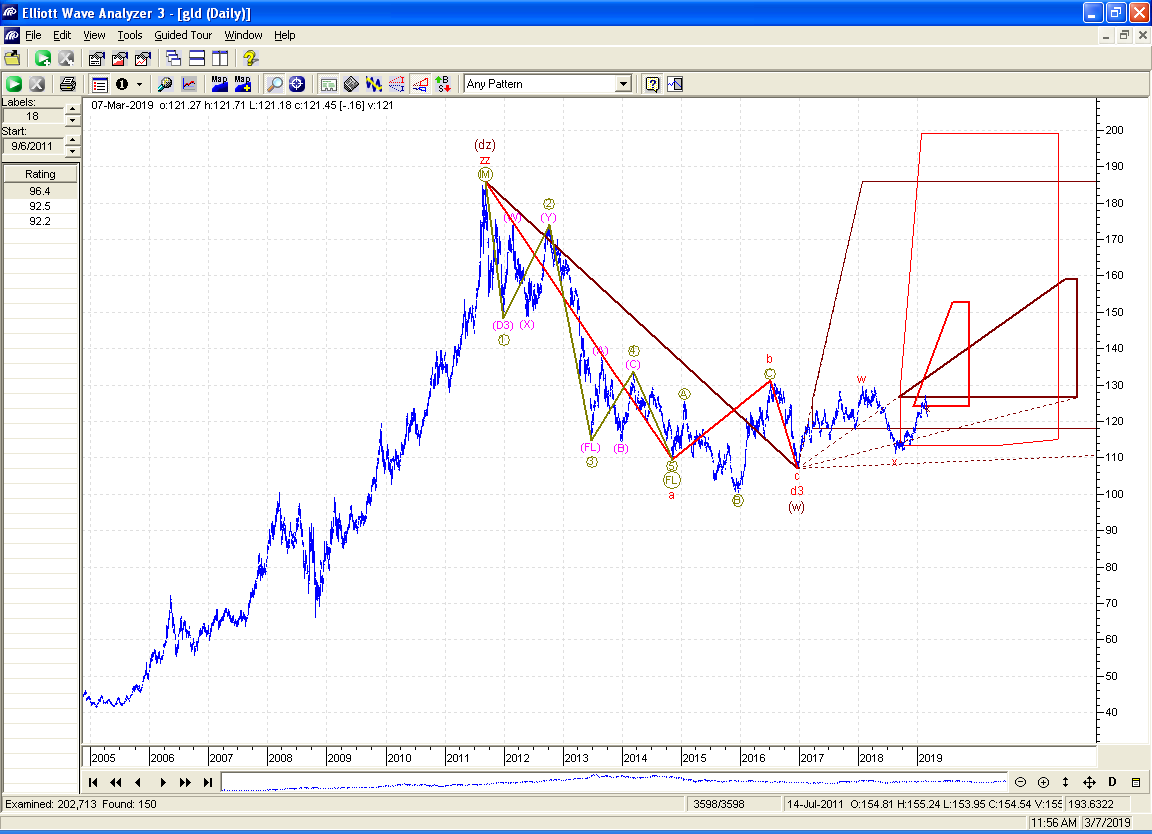
Notice the brown line labeled (dz) that runs from 2011 to the end of 2016? That would equate to the first leg down.
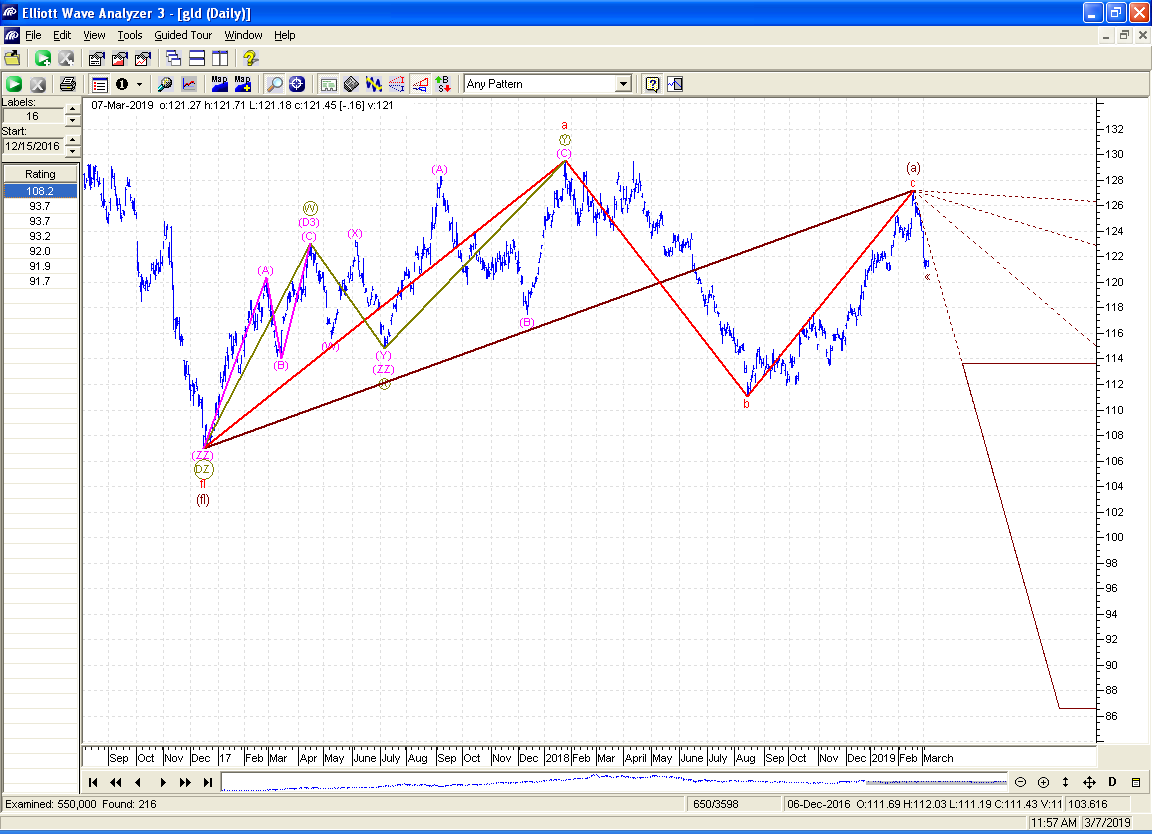
In this second chart, notice the brown line labeled (fl) that runs from the end of 2016 until February of this year? That would equate to the leg up. The software says we are now just starting our next wave down.
I know, everyone looks at the charts and says that makes no sense, right? Well, the next chart shows how that scenario fits very well within a larger time frame. NOTE – I did not draw this chart, in fact, I really wish that I knew who did. It was someone here at Goldtent, or possibly the Rambus Chartology Forum (if anyone knows, please give them credit in the comments). In any case, it demonstrates the point the software is making.
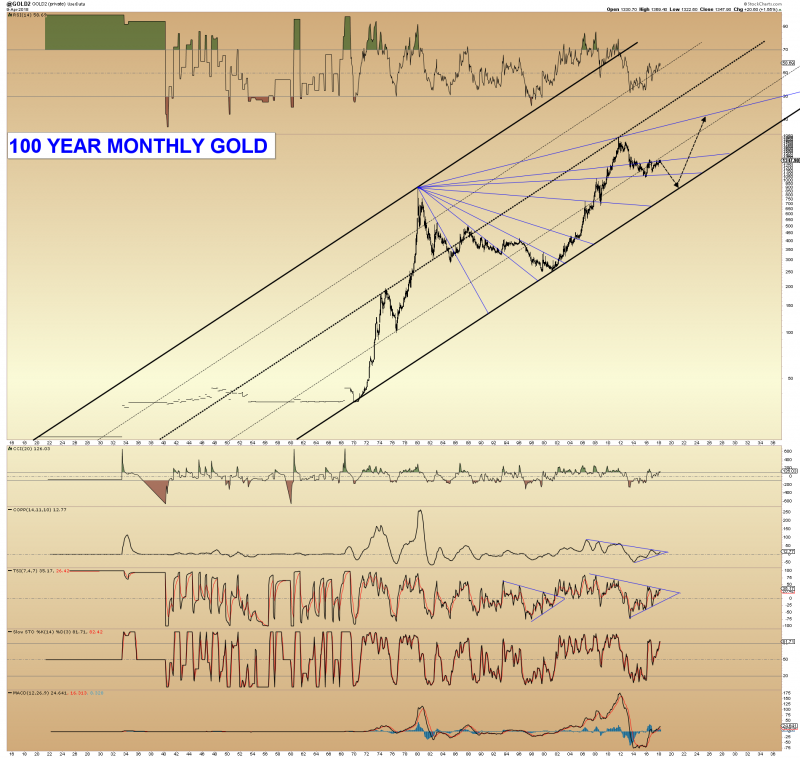
Sorry I don’t have great news and a rosy outlook, but as Morpheus said in the Matrix, “Remember, all I am offering is the truth. Nothing more.” Well, time will tell if it’s the truth, but it looks plausible.
Thanks Ken. Yes, that is plausible, although it doesn’t fit with my ‘base case’. It is clearly possible. We’ll have to see how dollar/PM’s etc perform in the next 6 months or so. If $1400 is broken to the upside, I’d write this scenario off. Until then, it’s possible.
Thanks Nortstar. Just presenting an alternate view with the research that backs it up.
Ken:
Isn’t your EW chart contradicting the third chart? That is unless the big B wave turns into an irregular and kisses the old high?
Not sure I quite understand your question Jim. The second EW chart show that the B wave is already complete (unless it morphs into a more complicated correction). As of now the correction shows as a flat. The bottom line is that we still have one more big leg down as shown by all the charts.
Ken:
I’m referring to your EW software chart showing boxes projecting an upside resolution. It seems the software is in conflict currently with the 100 year chart. That could change, of course, over time.
I think I know what Jim means. Is the first chart showing a move up into the target boxes before the leg down ?
Oh, I see. Yes, that move shows that it has reached both target boxes. The second chart shows that same wave in more detail and identifies it as complete.
That’s Sir Schism’s chart. Me and him came up with the scenario.
Nice work guys! You were on to this way before I was.
Nice work Ken.
What about the large red polygon though ? It shows a target as high as 200 (unless I’m reading it wrong).
You’re right North Star. That’s why I included the second chart. It shows that wave (Dec 2016 to Feb 2019) as completed. It met its minimum target and should not be making any more new highs.
I see. Thanks.
As of the EW guys here … Ranchida is on indefinite leave by the way …
I will weigh on what the human EW folks are saying re PM space.
Hendrik Zeberg agrees with you …. apocalypse now. See his weekend tweets.
Daneric posted his gold update Wed or so. His view lines up with my friend Sam: B is not over: its not been a basic abc internally b/c the b wave has been a triangle that’s not quite done.
It should finish ‘shortly,’ then c of B up to 1500 give or take. THEN SHTF and not just gold. Maybe THE GLACIERS ARE COMING, THE GLACIERS ARE COMING. I don’t know.
Thanks Ken!
The 100 year Gold chart reminds me of the long term charts of Bitcoin. Digital Gold Impostor!