2019 Emerging Markets Sector Rotation
Looks like several Emerging Market nations are starting to “emerge”, that is, breaking out of downtrends against the Nasdaq 100 and gaining bullish postures in their nominal charts. Let’s take a brief journey around the world…
The Middle East:
MSCI classifies Qatar, Egypt, Morocco and the UAE as Emerging Market economies. Seeing bullishness for the WisdomTree Middle East Dividend Fund (GULF) which has 55% exposure to Qatar, UAE, Egypt and Morocco. The GULF fund broke out of 4 year downtrend against the Nasdaq 100 in 2018. On GULF’s nominal chart we see a possible 5 year Inverse Head and Shoulders pattern with a potential upside of 36%.

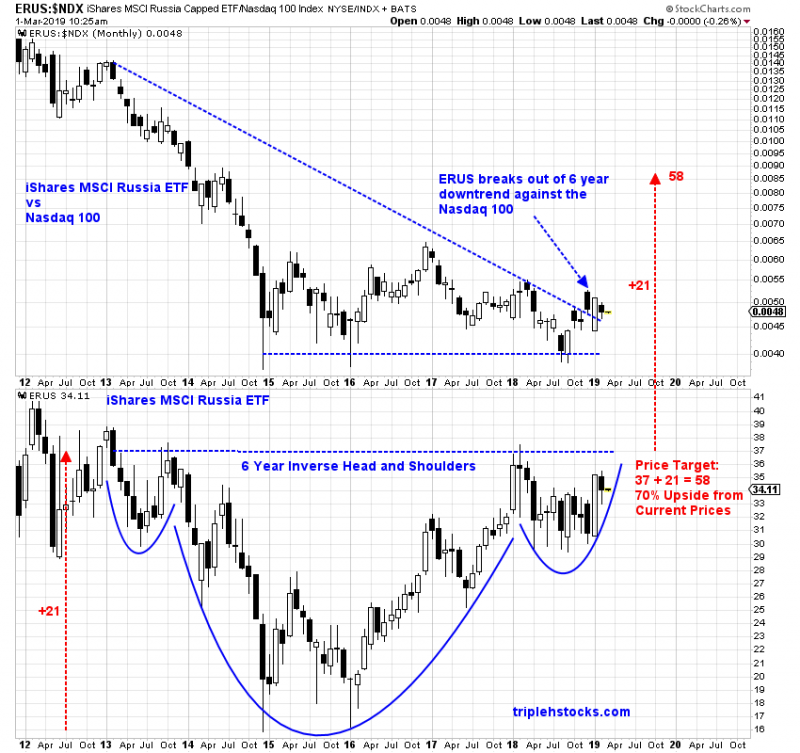
Russia:
The iShares MSCI Russia ETF (ERUS) broke out of a 6 year downtrend against the Nasdaq 100 in December 2018. On ERUS’s nominal chart we see a possible 6 year Inverse Head and Shoulders pattern with potential upside of 70%
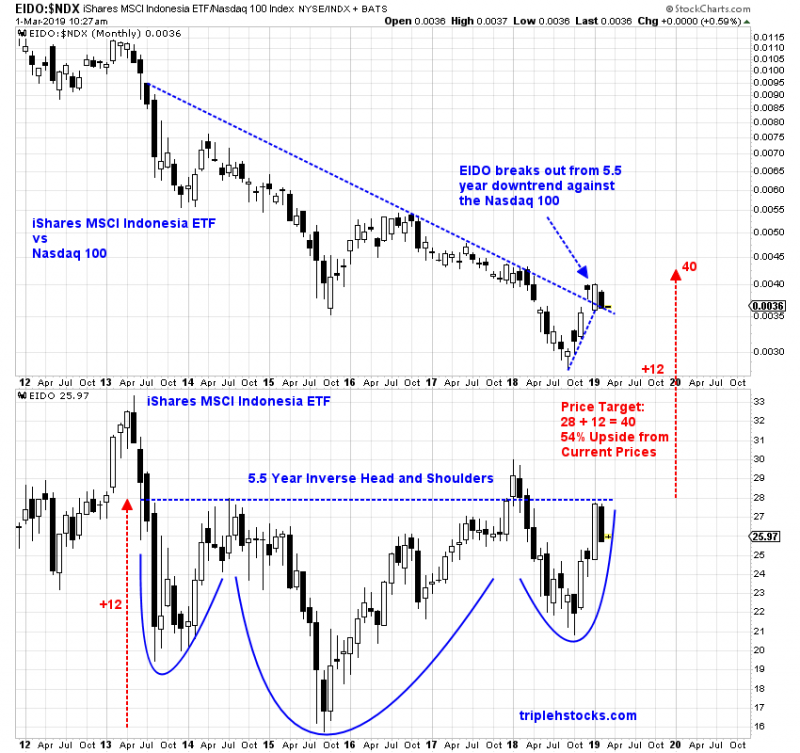
Southeast Asia:
The iShares MSCI Indonesia ETF (EIDO) broke out of a 5.5 year downtrend against the Nasdaq 100 in December 2018. On EIDO’s nominal chart, we see a possible 5.5 year Inverse Head and Shoulders with potential upside of 54%
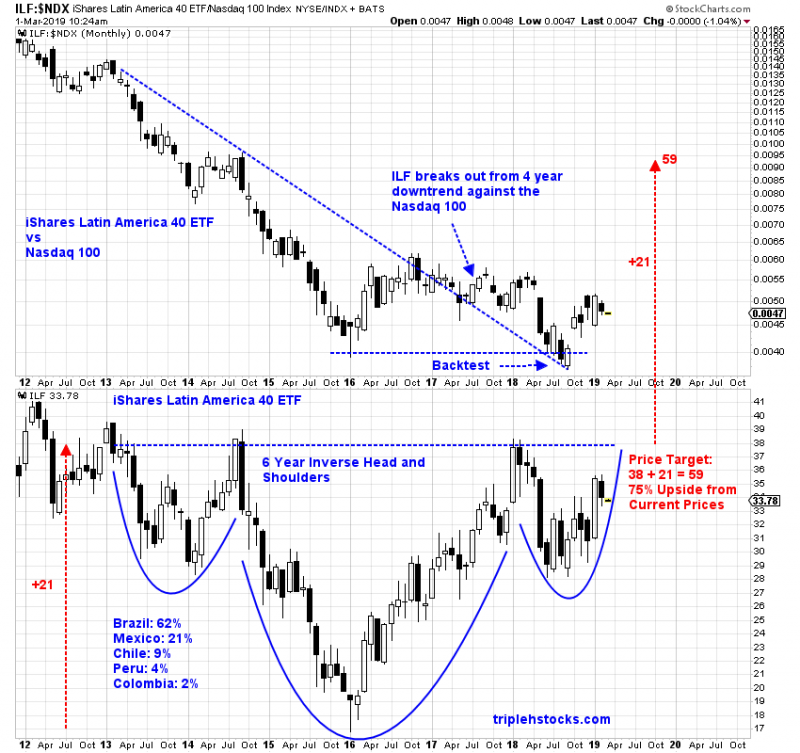
Latin America:
The iShares Latin America 40 ETF (ILF) broke out of a 4 year downtrend against the Nasdaq 100 in mid 2017, backtested in mid 2018. On ILF’s nominal chart we see a possible 6 year Inverse Head and Shoulders pattern with potential upside of 75%
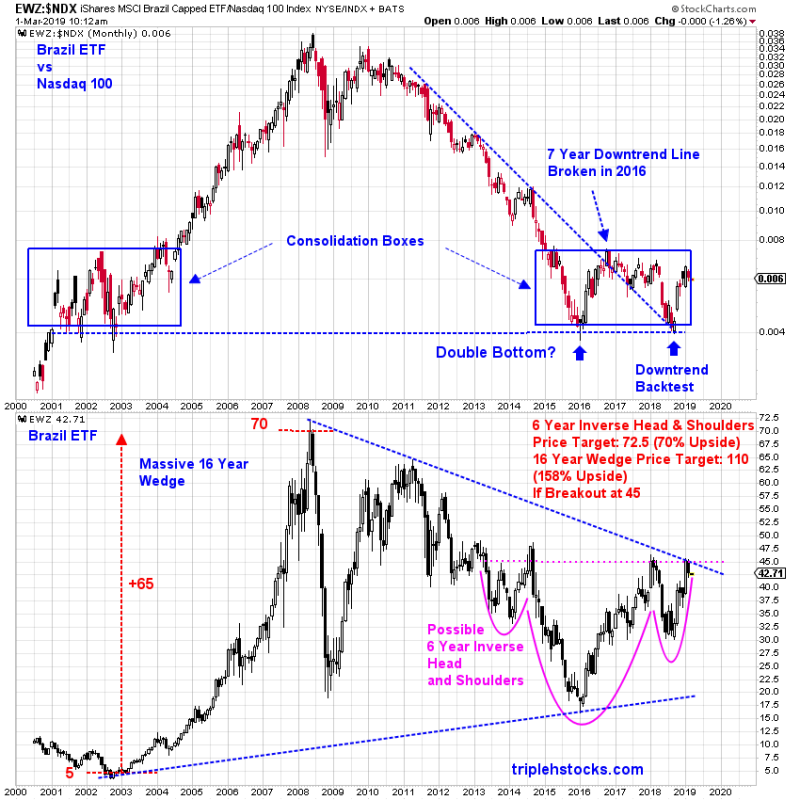
Brazil:
My favorite long term chart recently: The iShares MSCI Brazil ETF (EWZ) broke out of a 7 year downtrend against the Nasdaq 100 in 2016 with a backtest in mid 2018. Looks like the EWZ:NDX ratio found long term support at ratio level 0.004 which was also support in the early 2000s. A break of the ratio below 0.004 would make this long term ratio chart look like a massive Head and Shoulders top.
On EWZ’s nominal chart, we see the possible intersection of a 16 year Wedge pattern and a 6 year Inverse Head and Shoulders pattern. The 45 level is a key level, representing the neckline of the 6 year Inverse Head and Shoulders, and a possible breakout level for the 16 year Wedge. The breakout of these two formations may happen within months of each other. Potential upside of the 6 year Inverse Head and Shoulders is 70%, with 158% possible upside for the 16 year Wedge.
Broader Emerging Market funds like the iShares EEM ETF or Vanguard’s VWO ETF are currently still in downtrends against the Nasdaq 100 and lack market momentum (you’d be better off buying the Nasdaq 100 than EEM or VWO for now). There is more market momentum and potential upside at the regional level (Latin America or Middle East) or country level (Brazil, Russia, Indonesia) for growth oriented investors. -Harry
Lovely charts there. Thanks for sharing.