Bitcoin: GBTC Attempting Breakout from Nasdaq 100
Thanks to Ken for keeping my eye on Bitcoin! If you recall my previous post on Bitcoin, I showed how the NYSE Bitcoin Index is still in a downtrend against the Nasdaq 100. That Bitcoin index is in fact still in a downtrend:

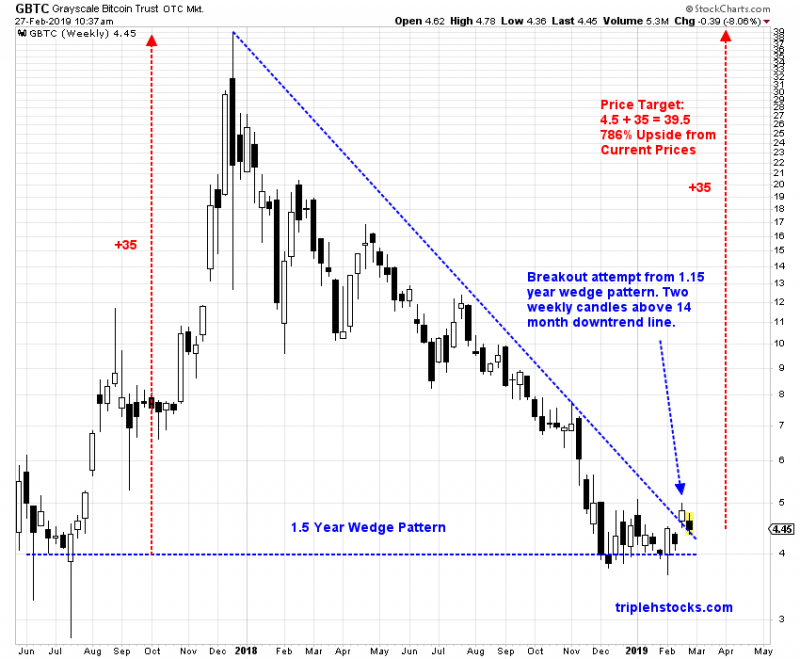
However, I am seeing a breakout attempt when looking at the ratio of the Grayscale Bitcoin Investment Trust (GBTC) versus the Nasdaq 100. We see two weekly candles above the 14 month downtrend line and a possible 1.5 year wedge formation.

On GBTC’s nominal chart, we see a breakout attempt from a 1.5 year wedge pattern with a bottom at 4.0. This gives us a possible price target of 39.5, an upside of 786% from current prices.
Will continue to monitor these charts. Ideally, would like to see a breakout for the NYSE Bitcoin index against the Nasdaq 100 for full confirmation of trend change. Keep in mind that Bitcoin is a volatile asset and breakout attempts can turn out to be false breakouts and bull traps. The breakout featured in these charts can reverse and trap you. However, Cryptocurrency investors with an itchy trigger finger may consider taking smaller, risk managed positions with stops in GBTC. For example, a weekly close below 4.0 can be used as a stop for a GBTC trade. -Harry
good stuff, McAfee hopes so too 🙂
“Believe in something. Even if it means sacrificing your dicknity.” – John McAfee 🙂
looked at bitcoin again and second bounce off center bolly and above 100 daily line, sneakin up for sure, never followed the stuff but might as well join the generation x.
Chipotle, Tesla, FAANGs, weed and Bitcoin. Millennial portfolio!
lol ! Am I the only one here seeing the dow trans rolling over, spx bounce down from resistance. 🙂