Four Points to Ponder
I like Northstar’s chart, and will reproduce it with additions below.
- The dollar has a distinct falling wedge pattern. Blue lines top and bottom, bottom added by me. Falling wedges are bullish, no ifs, ands or buts. We got an upside breakout of the falling wedge, followed by a long backtest that just so happened to coincide with a horizontal support as well as a rising trendline from the previous bottom. BOINK. (Thank you FGC)
- Notice the 3 vertical green lines. First one is before the top of the target cycle, second is at or near the top, third is after the top, right about where NorthStar postulates a dollar top.
- Consider the backdrop behind these charts. If everything was pure technical and cycles, it would not matter what else happens in the real world, we would all follow the cycle. The previous 30 years has been a long story of a declining US empire, whereby the US loses economic clout compared to everyone else, and a falling dollar reflects that. But something changed in the early teens of this century. All of a sudden the US economy, as bad as it looked to us, was positively glowing compared to everyone else. (China excepted, they are in a different cycle, as well as still being a quasi-developing country) Witness long term yields on dollar assets compared to European assets. Also notice that we are becoming a major oil producer, as well as becoming a stronger economy compared to the rest of the West.
- This is all well and good, but….. WHAT happens when it starts to unravel under the burden of record setting debt, worldwide? Especially so for debt outside the country denominated in dollars? We are getting dangerously close to pulling the recession trigger with the yield difference between the 10 year and 1 year Treasuries. (100% accurate calling a recession when it goes negative, currently at .16 difference. A recession is looking very likely in 2020 based on the yield curve indicator as well as other, less obvious stuff going on that DC is not looking at.
Now to the chart:
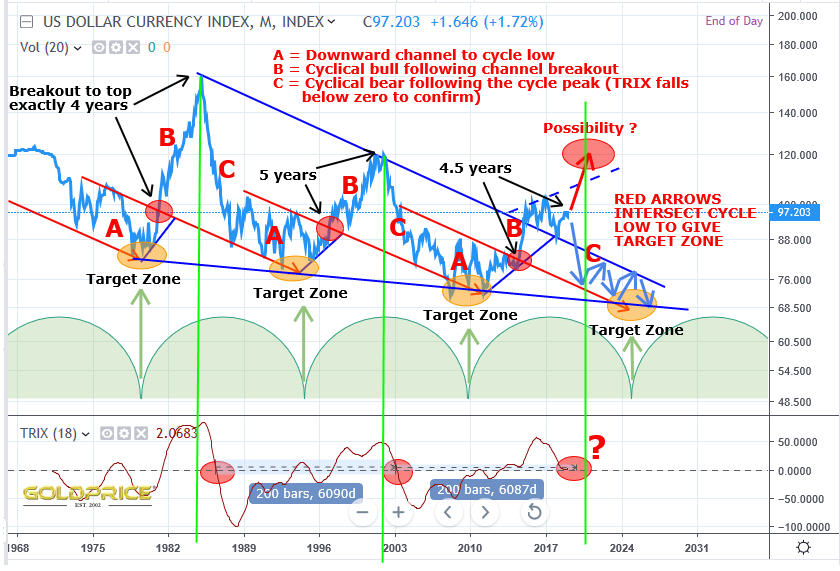
Great stuff. A descending wedge, breakout and backtest. It’s strange, but gold finds itself in a similarly bullish position. I’ve posted the long term gold wedge, breakout and backtest recently. Surely only one can triumph. There’s no denying the bullish interpretation of the dollar chart, leading to a possible 20% appreciation in a very short period of time. It’s difficult to square this particular circle.
I agree. Been following the classic chart patterns for gold, wondering when it was going to pull the trigger and start a new bull market. Only problem I saw with that view is volume on the upside has been weak, and the underlying economy says that gold is not likely to go up at this time. December retail sales were abysmal, and although one month a trend does not make, I think its indicative of the future. When the dollar squeeze happens the dollar soars, gold falls, then the reverse is likely to occur when everyone realizes the dollar has no real value. That’s a few years down the road.