Charts
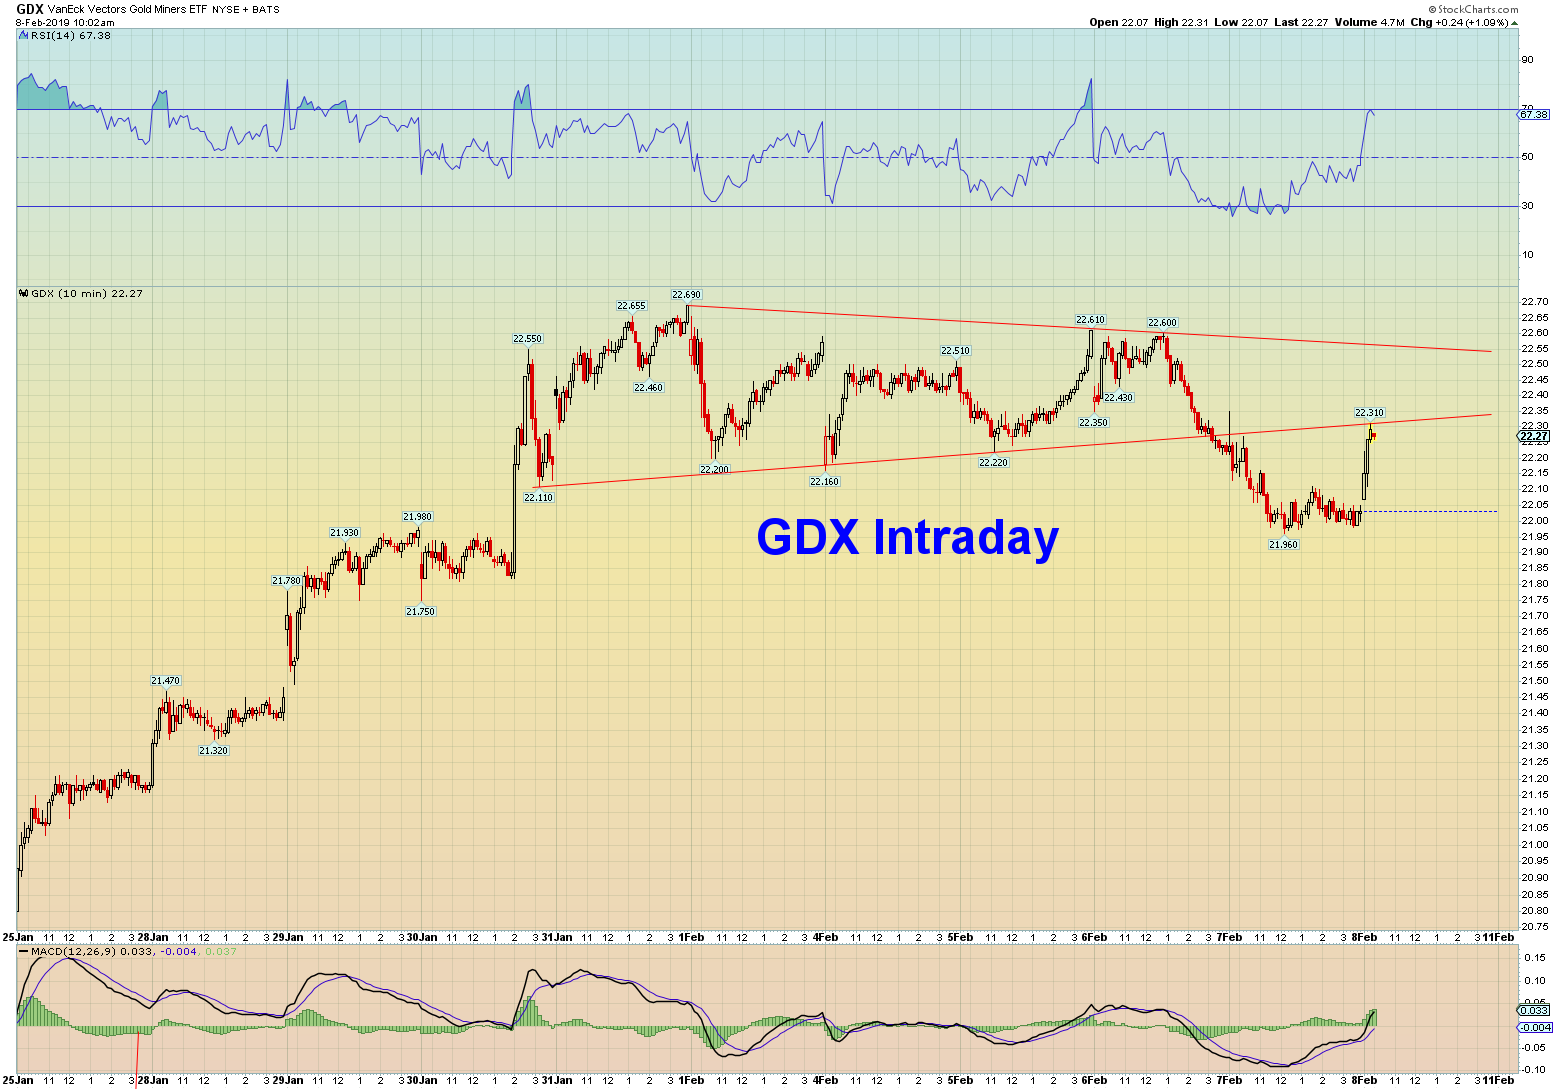
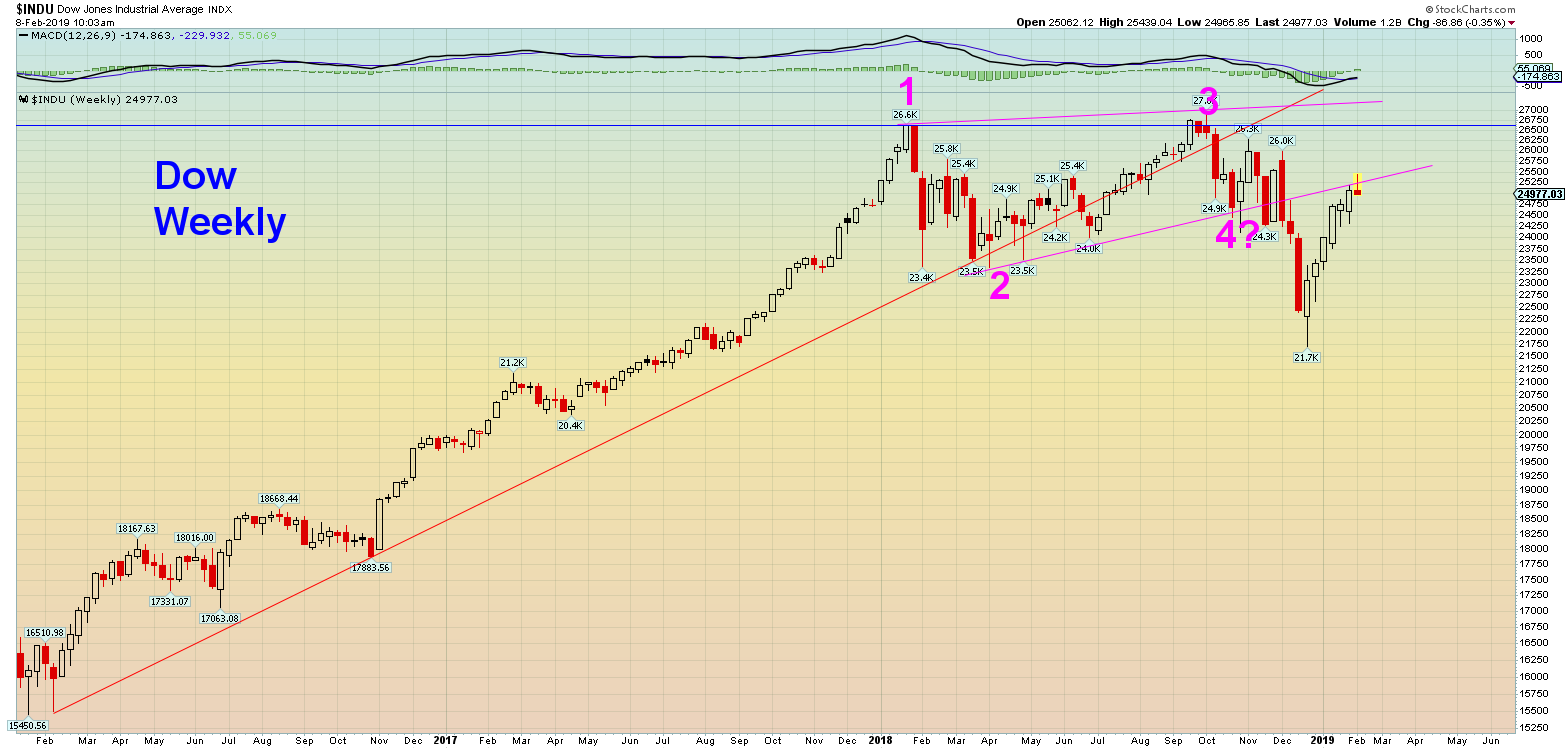
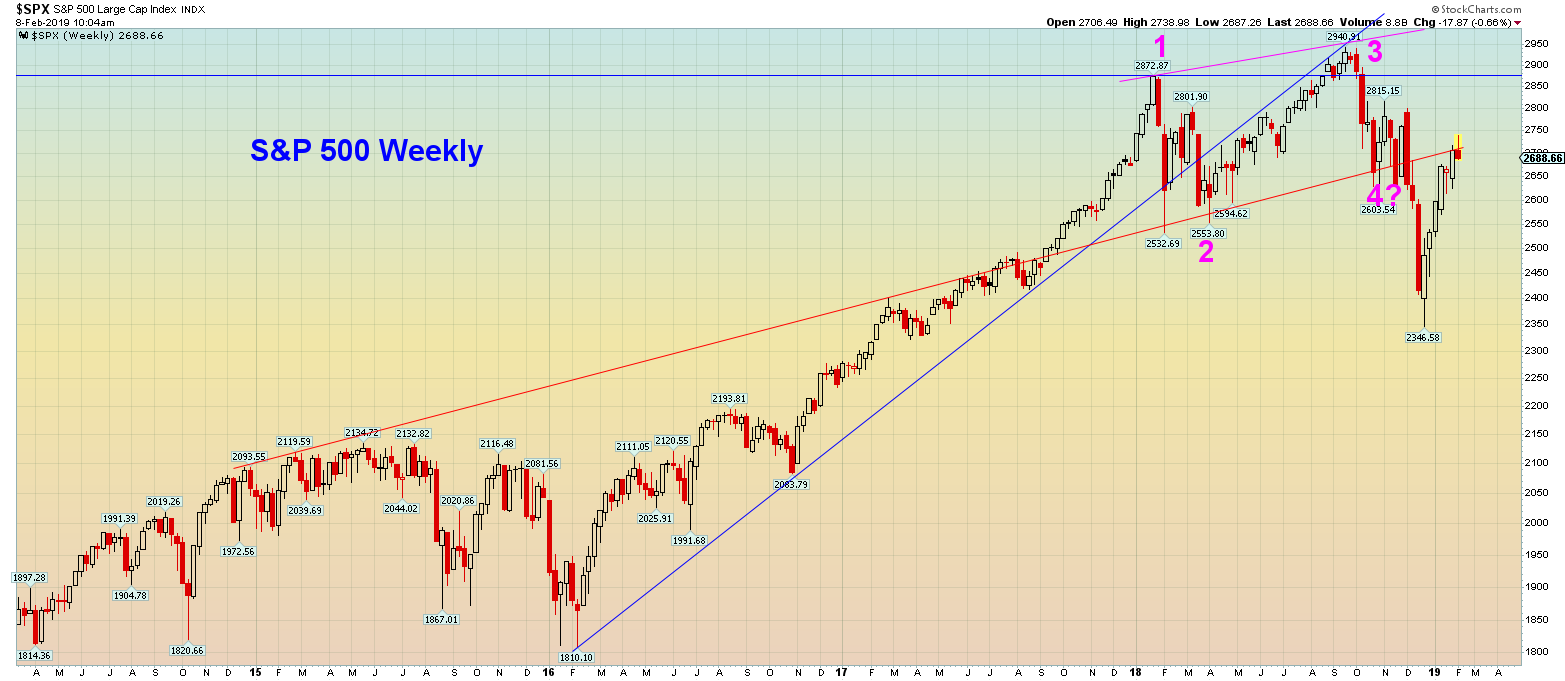
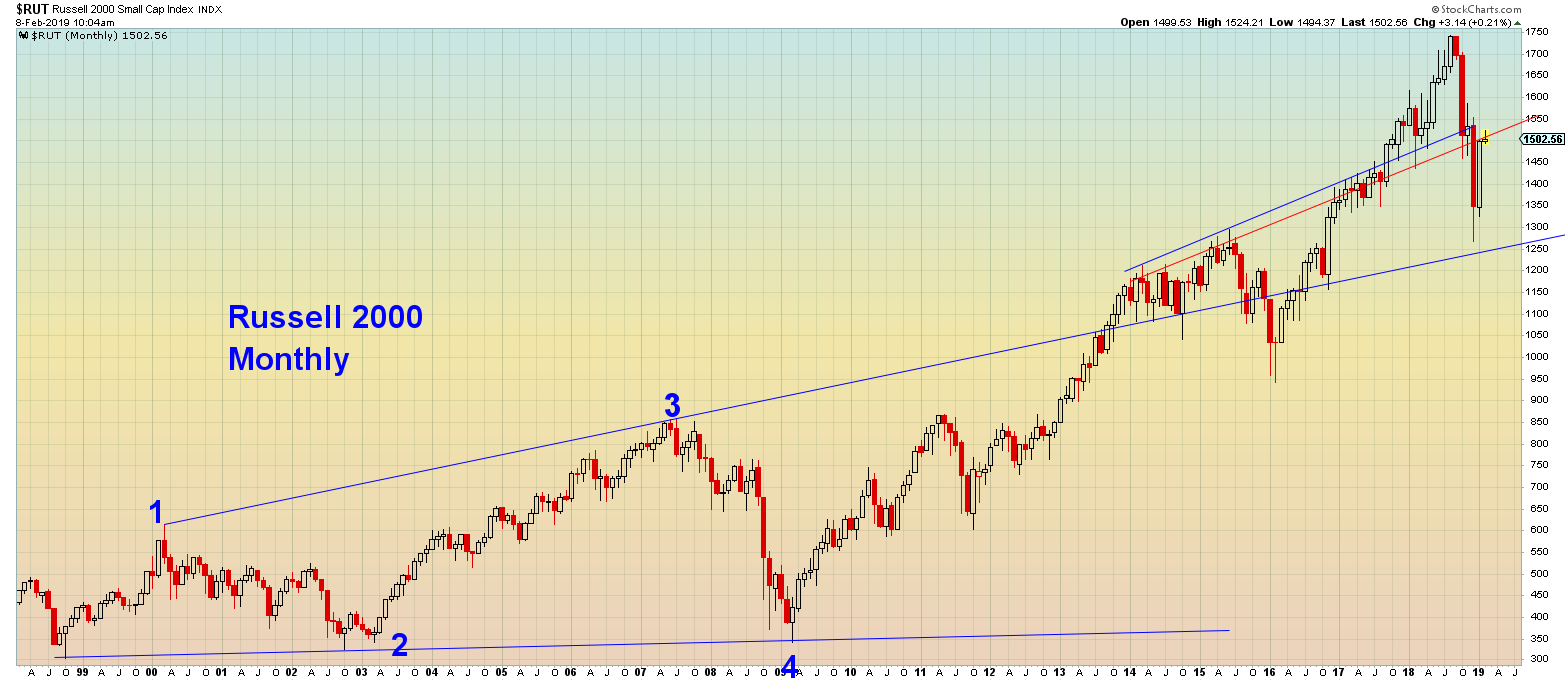
The little patterns like above on the indices are happening right at significant points like seen below. Above could still morph into a bull flag so nothing is certain but we’re at a major inflection spot indeed.
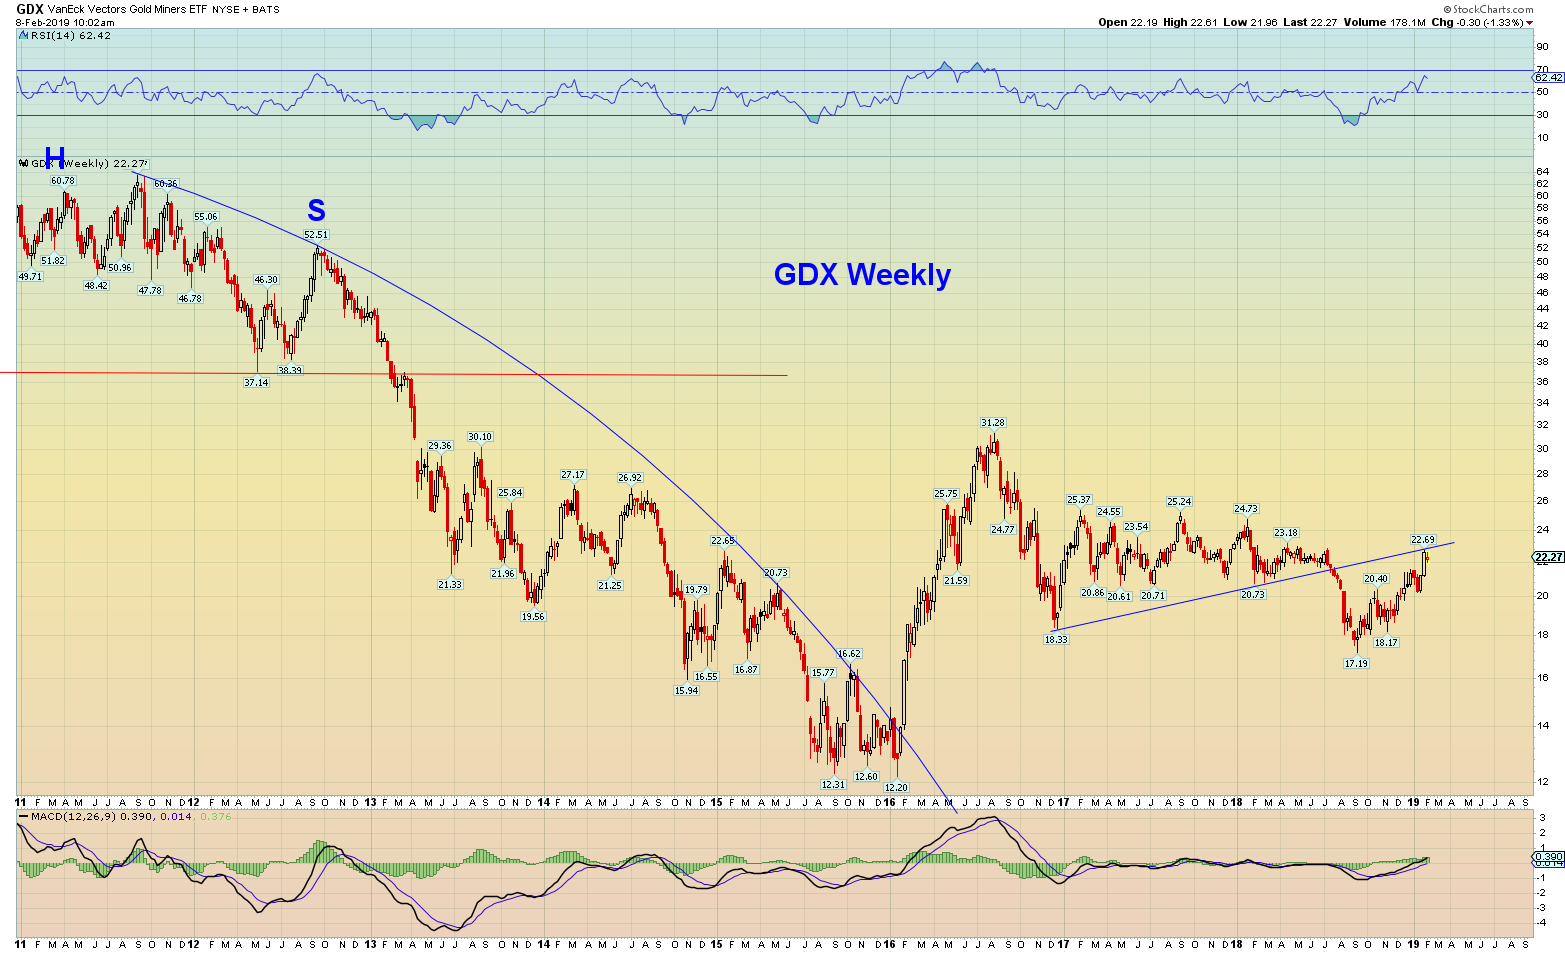
GDX Weekly:
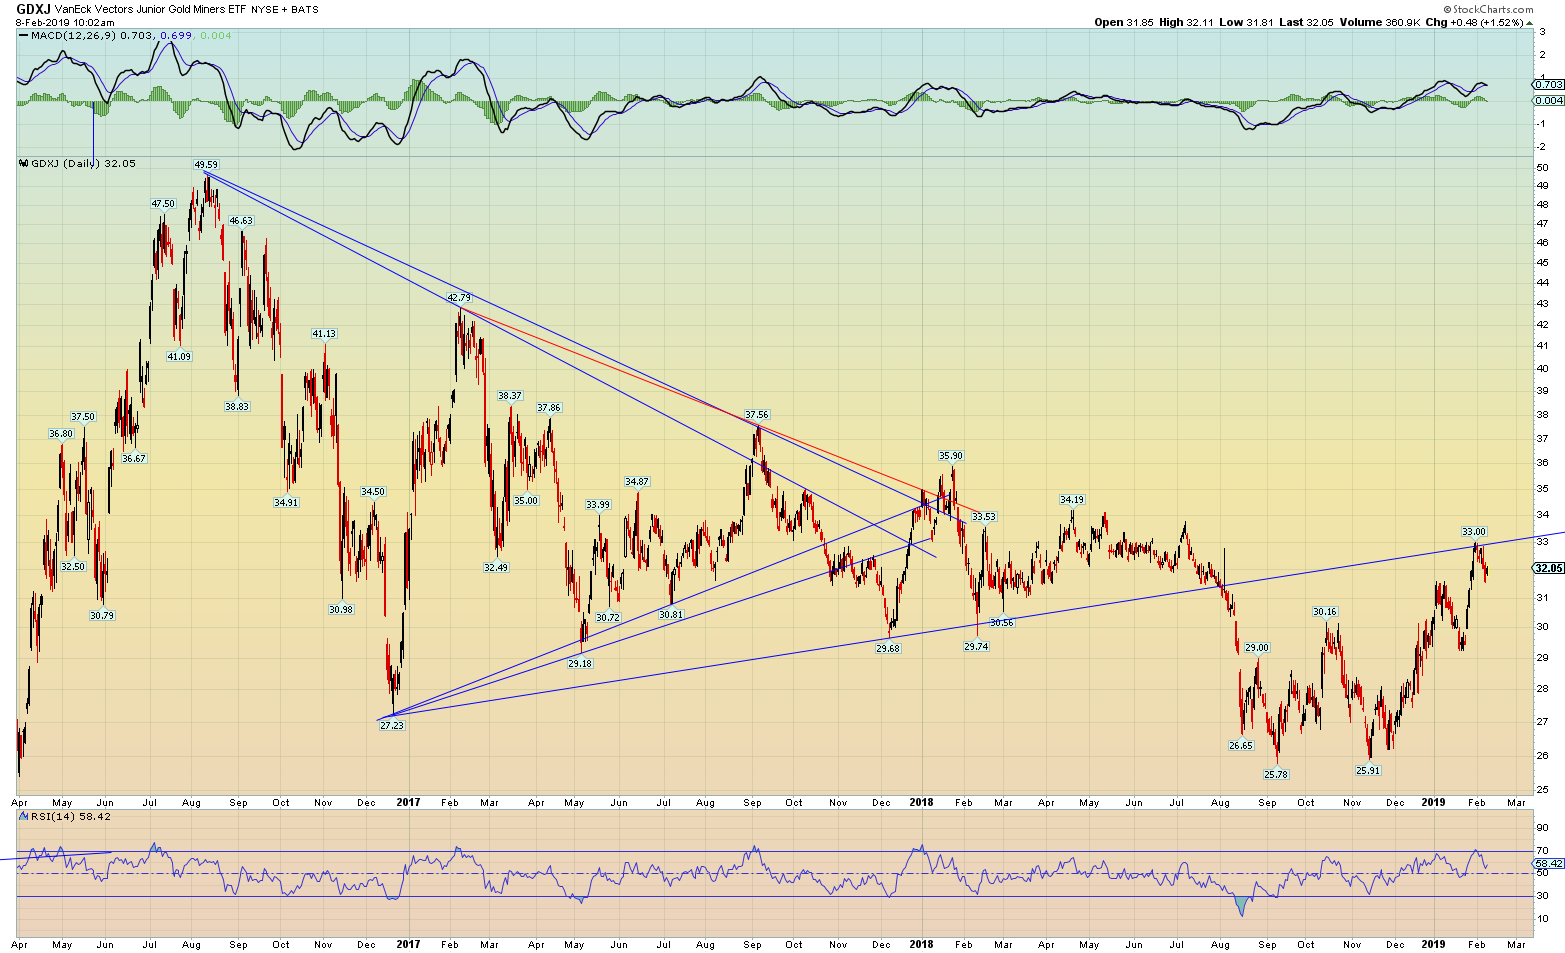
GDXJ Daily:
DUST Daily:
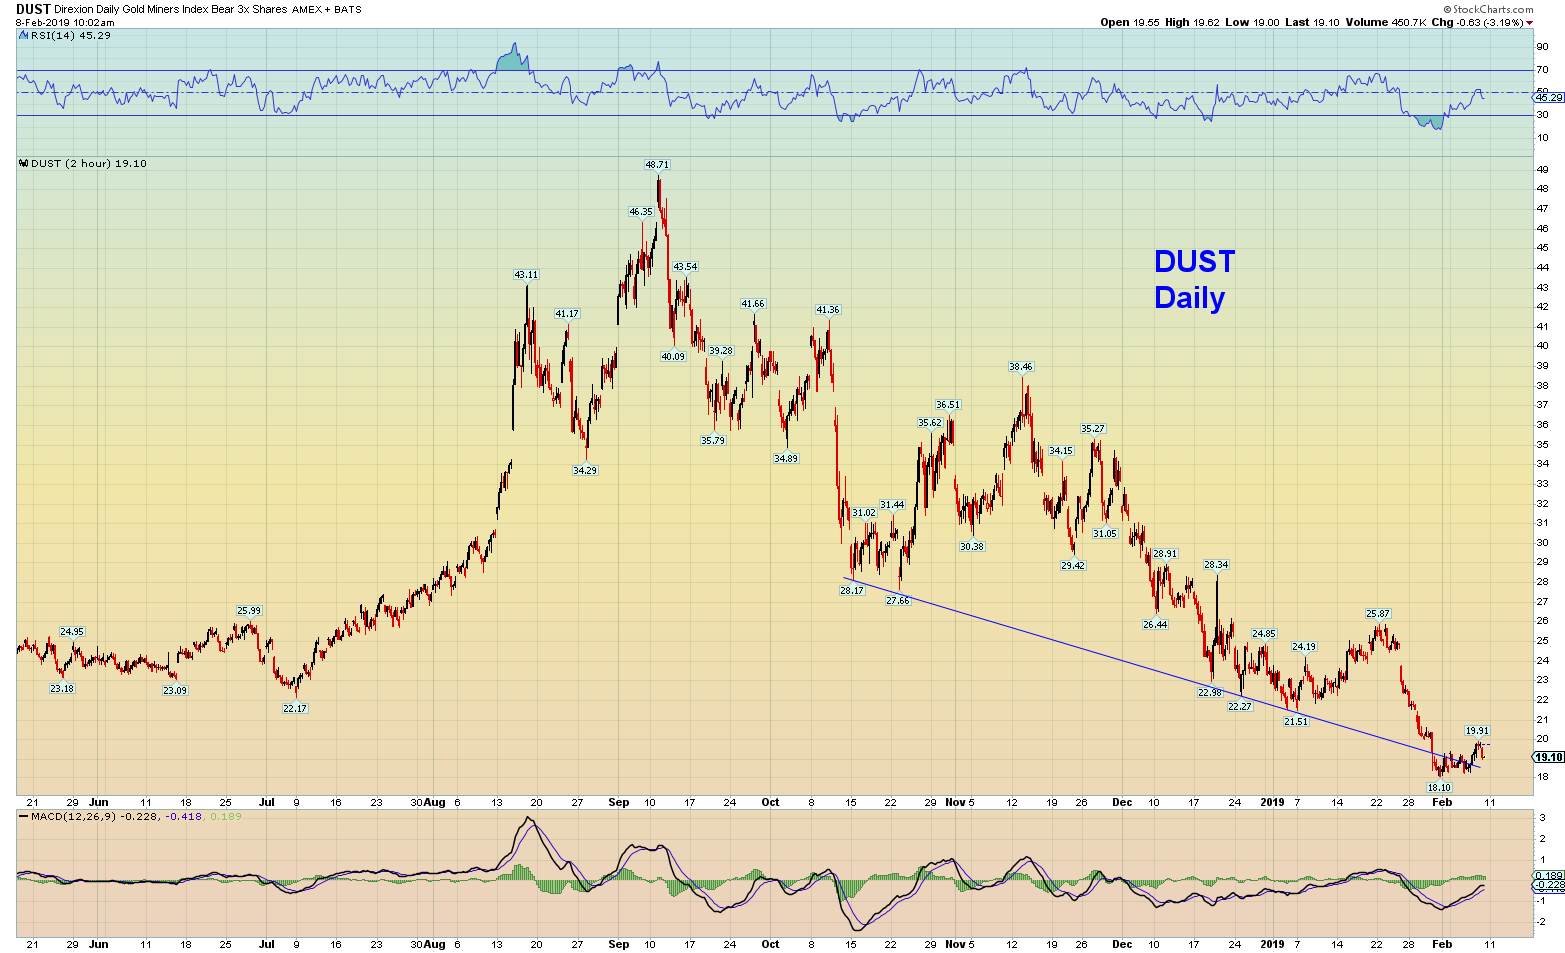
Dust had what could end up being major false breakdowns as seen on these charts. I believe these will end up being false breakdowns and the major monthly downsloping line on DUST may get hit again which is about 5X higher than today’s DUST price.
For the record: I don’t recommend using any 3x leveraged instruments. They decay too much and destroy you if you’re wrong… Don’t get much lower risk than this though. Buy now and put a stop somewhere below the recent lows is about as low risk as you could get in these 3x’ers…
DUST Montly:
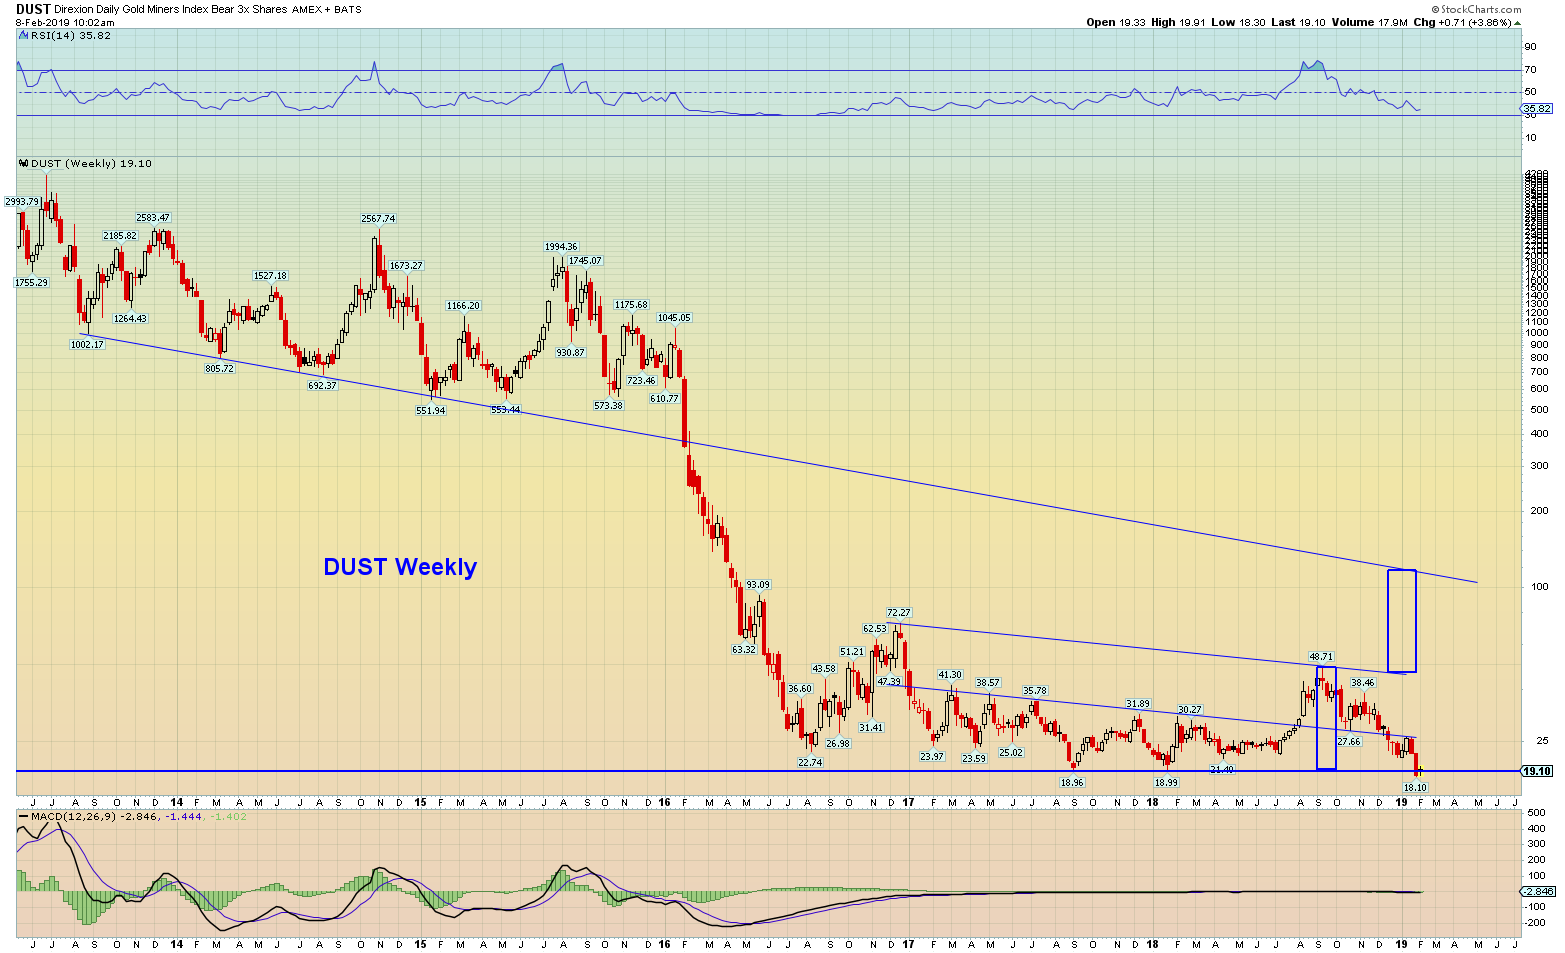
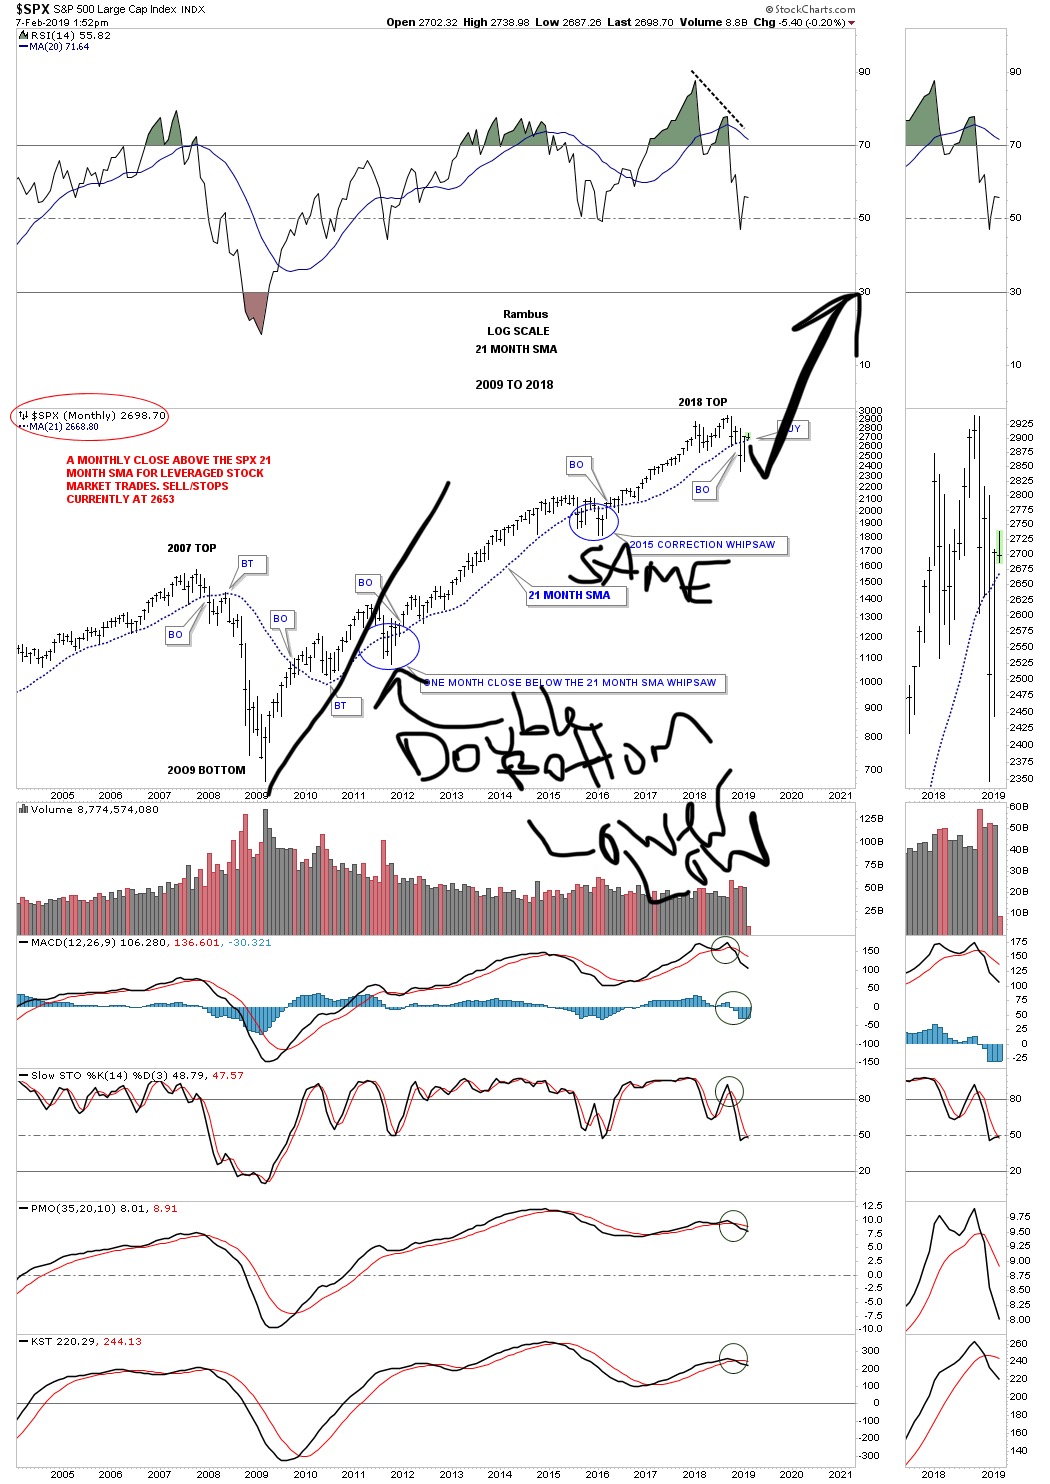
This is Rambus’ chart below that I scribbled on. He’s bullish. I believe he’ll be right. I just think we’ll end up seeing what happened in 2011 and 2015/16. Double bottoms with some having slightly lower lows which flip everyone bearish before reversing and scorching the brand new shorts.
Thanks Chuck for updating your charts and your perspectives.
I appreciate how you can “stand back” and look at the big picture first – not always right, but risk/rewards are always enticing!
Thanks Patty. Means a lot coming from you.