Brazil Long Term: Time to Party in Rio?
Brazil has been hot lately after electing Bolsonaro as President in 2018. Daily charts look bullish so I wanted to take a look at the long term development of the EWZ ETF.
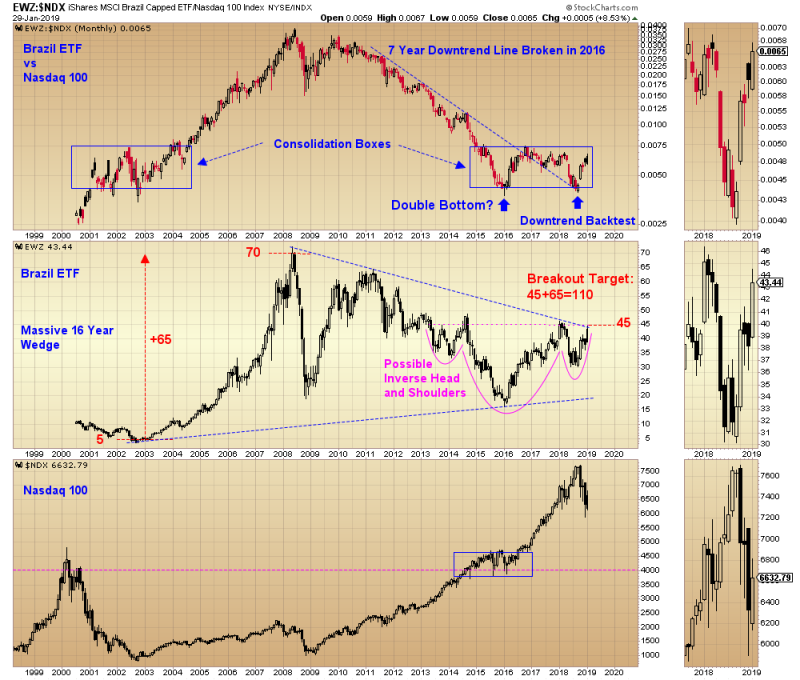
When we plot a long term ratio of EWZ against the Nasdaq 100, we see a round trip, pyramid pattern with two consolidation boxes at opposite ends at similar ratio levels. 2016 saw the EWZ:$NDX ratio break out of a 7+ year downtrend, with a backtest of the breakout in 2018. The ratio still has a bit of work to do before breaking through the second consolidation box (either up or down).
When we look at EWZ’s nominal chart, we see a massive 16 year wedge containing the 2002 lows, the 2008 highs and the 2016 lows. From 2013 through 2019, we also see a possible inverse head and shoulders with a right shoulder that intersects with the larger wedge pattern. If a breakout of the wedge and inverse head and shoulders were to happen at the 45 level, we can see a possible measured move target to 110, which would be 144% upside from the 45 level if the breakout does occur.
Could a bullish trajectory of the Brazil ETF indicate future strength in the commodity complex, particularly oil? It’s very likely. -Harry
Could it be a Huge H and S Top Harry ?
Yes it can! If the ratio breaks below the second consolidation box, the Top looks more likely, retest the 2000 lows.
I have been trying to make sense out of this as well….the Brazilian Real
https://www.tradingview.com/x/hWtaWwKa/
Its not real its fake
🙂
lol
Some more interesting geometry-
https://www.tradingview.com/x/2YqoTrk5/
https://www.tradingview.com/x/MU8wVbyn/
Schism those charts are amazingly spooky! Seems the US Dollar/Real Cup and Handle breakout was prevented at the same the EWZ / NDX top was prevented. Thank you for sharing another important piece of the puzzle!
Did Mr Market not price in Bolsonaro’s victory? Reminds me of Trump in a way: Bolsonaro is a conservative/populist who was not anticipated to win. Following the political upset, a squeeze on shorts and FOMO on sidelined longs which propped up the Real and Brazilian equities… ?
Seems spooky that the Bolsonaro victory is the event which broke the USD/Real Cup and Handle and the EWZ/NDX top…
Commodity cycle should improve the prospects of the export economies like Brazil, and its currency. The same applies to Canada and Australia imo. At the very least,it mitigates against whatever other problems those countries have, political or otherwise. I’m a buyer of CAD and AUD. I’m also a buyer of the Euro (formerly known as the DM) as it tends to mirror the export currencies–perhaps because Germany is traditionally an export powerhouse.
Thanks Curly Top! Yes, I’m seeing some bullishness in the popular Canada and Australia ETFs (EWC and EWA) so I may go long there in the next weeks!