Semiconductors May Lead the Nasdaq Over The Next Several Years
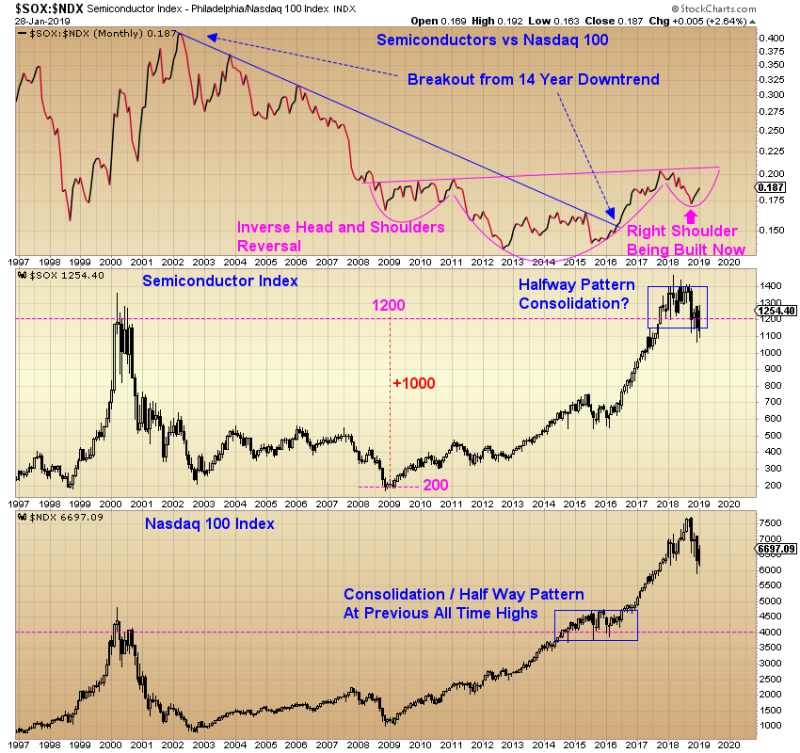
The Semiconductor Index $SOX made a high against the Nasdaq 100 in 2002 and was in a 14 year downtrend against the NDX, breaking out in the middle of 2016 around Brexit time.
The $SOX:$NDX ratio also shows a possible inverse head and shoulders forming around the 14 year downtrend breakout. The right shoulder of this possible inverse head and shoulders is currently being built.
When we look at the nominal chart of the Nasdaq 100, we see a half way pattern consolidation formed at the previous all time highs from 2014 through 2016. A similar half way pattern consolidation may be under development on the nominal chart of the Semiconductor Index. We also see a possible measured move target of 2200 for the $SOX Index, which is about 75% higher than $SOX’s current value of 1254.
If the Nasdaq / Tech bull market resumes, I would consider going long Semiconductor ETFs (SOXX, SMH, XSD) and stocks (Intel, Qualcomm, Texas Instruments, Micron, etc) -Harry
Thanks for sharing. Great chart!
No problem! I love making these long term sector breakout charts!