Let us PRAY !
Rambus has been cautiously bullish on the PM Complex But
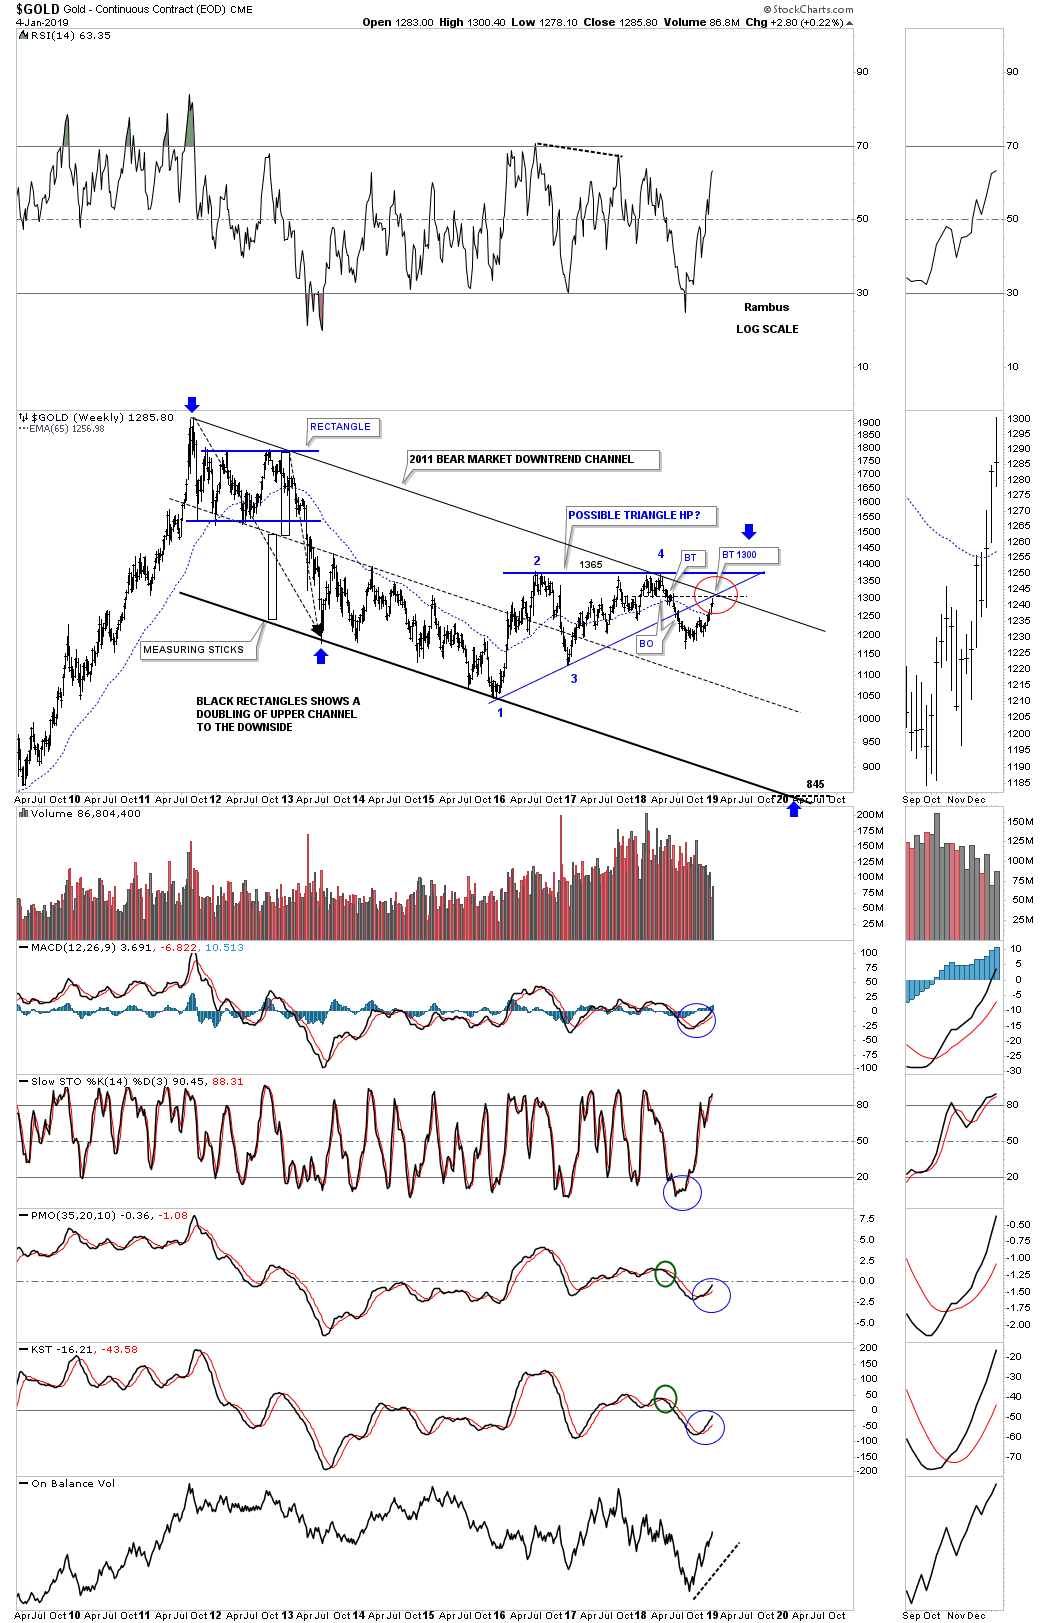
“There is always the bearish setup it seems. Below is a weekly chart for gold which shows its 2011 bear market downtrend channel with the 2016 triangle consolidation pattern. What this chart shows is the confluence of three important resistance points which all come together at 1300. First we have the bottom rail of the 2016 triangle. Next the thin dashed back horizontal line that is the bottom rail of the 5 point rectangle we looked at on the daily charts above. Then the all important top rail of the 2011 bear market downtrend channel as shown by the red circle. I kept the lines thin so you can see more clearly how these three trendlines intersect at 1300 which was last weeks high.
Keep in mind we should see an initial reaction down where the three trendlines intersect at 1300. What we want to see is a shallow move lower and then a strong move up and through the 1300 area that leaves no doubt the bulls are back in charge. The top rail of the 2016 triangle is also the neckline of the possible 2013 H&S consolidation pattern we just looked at. To say this is a critical inflection point is an understatement.”
all the best Rambus

Thanks, Fully.
We all should ??
recent Pedro EW count triangle is bearish. It is still the current powerful count till gets invalidated.
There is another bullish EW count still running and is not invalidated.
My comment in following post still holds.
https://goldtadise.com/?p=438468
A very important test for sure.