GOLD:VIX Ratio As A Stock Market Bottom Indicator
Interesting relationship between Gold, VIX and the S&P500 that precious metalheads may appreciate!
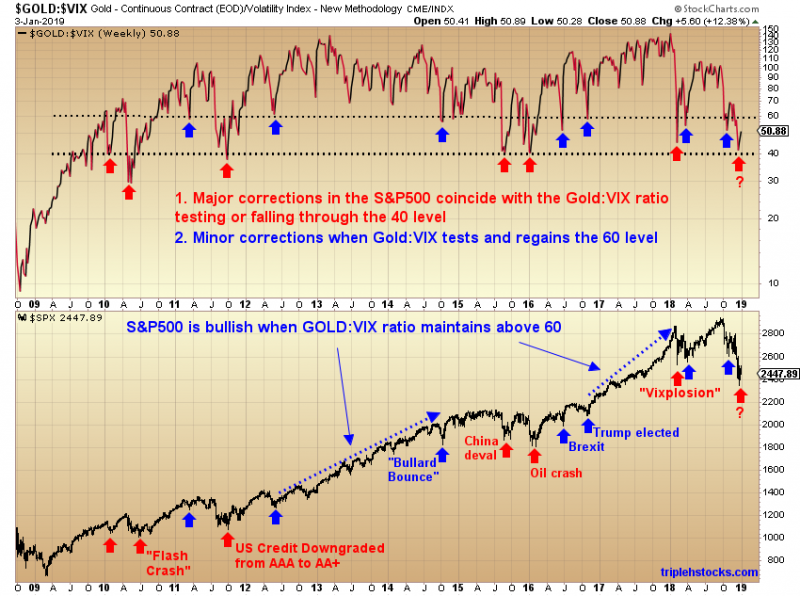
Since the 2009 crash, the $GOLD:$VIX ratio has defined a sideways channel with a top rail of 60 and bottom rail of 40. Deeper and longer corrections in the S&P500 coincided with the GOLD:VIX ratio approaching or falling through the 40 level. Minor and quicker corrections coincided with the GOLD:VIX ratio testing and regaining the 60 level.
When GOLD:VIX sustains above 60, we see the S&P500 expand to higher valuation. Most notably see this behavior from mid 2012 to late 2014, and late 2016 through early 2018.
Right now, with GOLD:VIX approaching 40, these conditions are most similar to the corrections surrounding the 2010 Flash Crash, the 2011 downgrade of US debt, the 2015 China Yuan devaluation, and the 2016 Oil Crash. The “Bullard Bounce” of late 2014, Brexit and the 2016 US Elections are examples of minor pullbacks in which the GOLD:VIX ratio briefly tests and regains the 60 level.
This chart is not definitively calling a bottom. It tells us that the relationship between Gold and the VIX is approaching conditions similar to when previous market bottoms occurred. Happy New Year and a prosperous 2019! -Harry
That’s interesting, but how would it behave in a secular bear market ? It would repeatedly fall back to between 40 and 60.