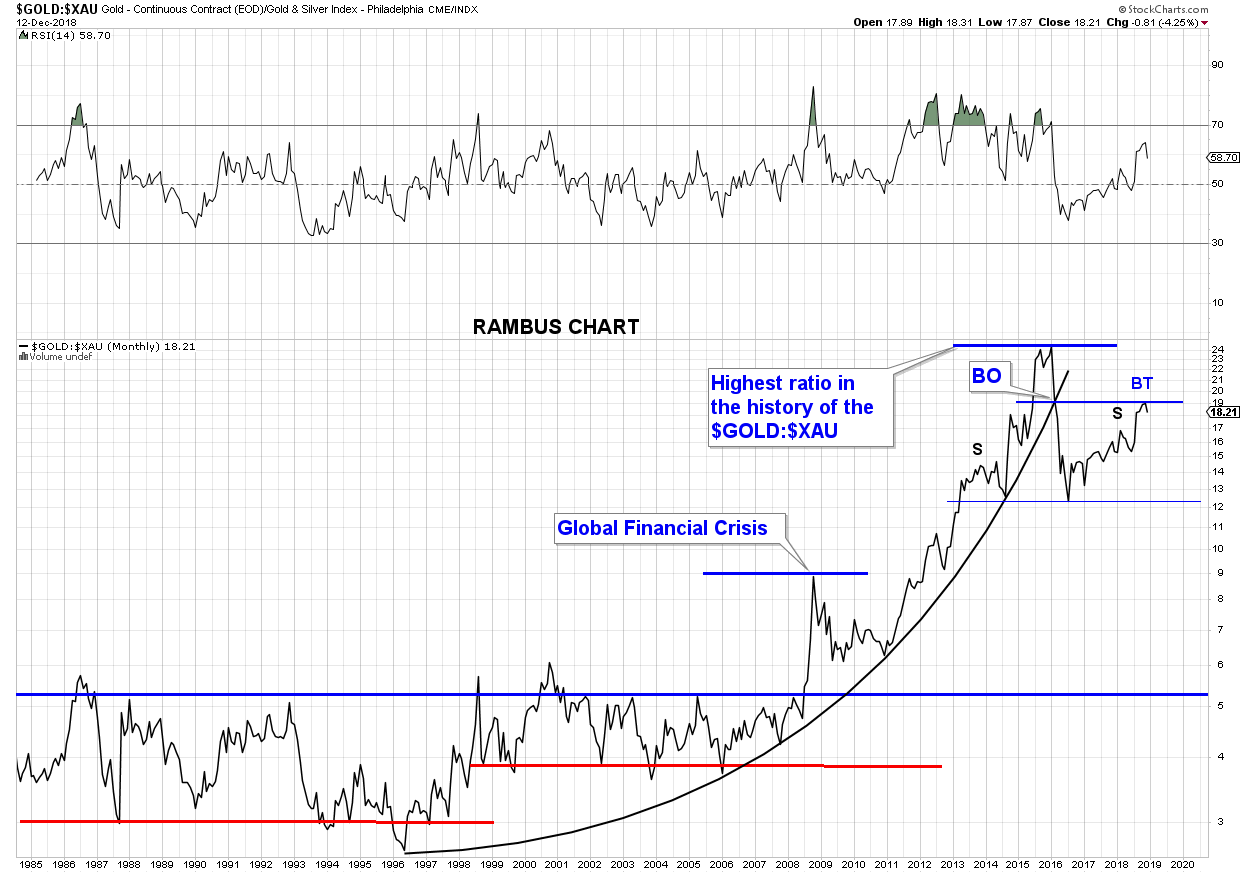
$GOLD:$XAU BT to the 2016 break down
Was recreating this Rambus chart posted a few days ago. Wanted to keep a copy in my chart list. Check out the break down from the parabola in Jan/Feb 2016 (the baby bull) and the recent high in the $GOLD:$XAU ratio. Coincidence ? Nope. Its Chartology. Thanks again, Fully, for the post.
Ha . That’s a novel way to note a backtest.
Shall we call it the Silverfox Parabola Backtest
🙂
Call it what you will. It gives me a little more confidence that the PMs have bottomed.