Credit spread warning
Credit contraction is in the making.
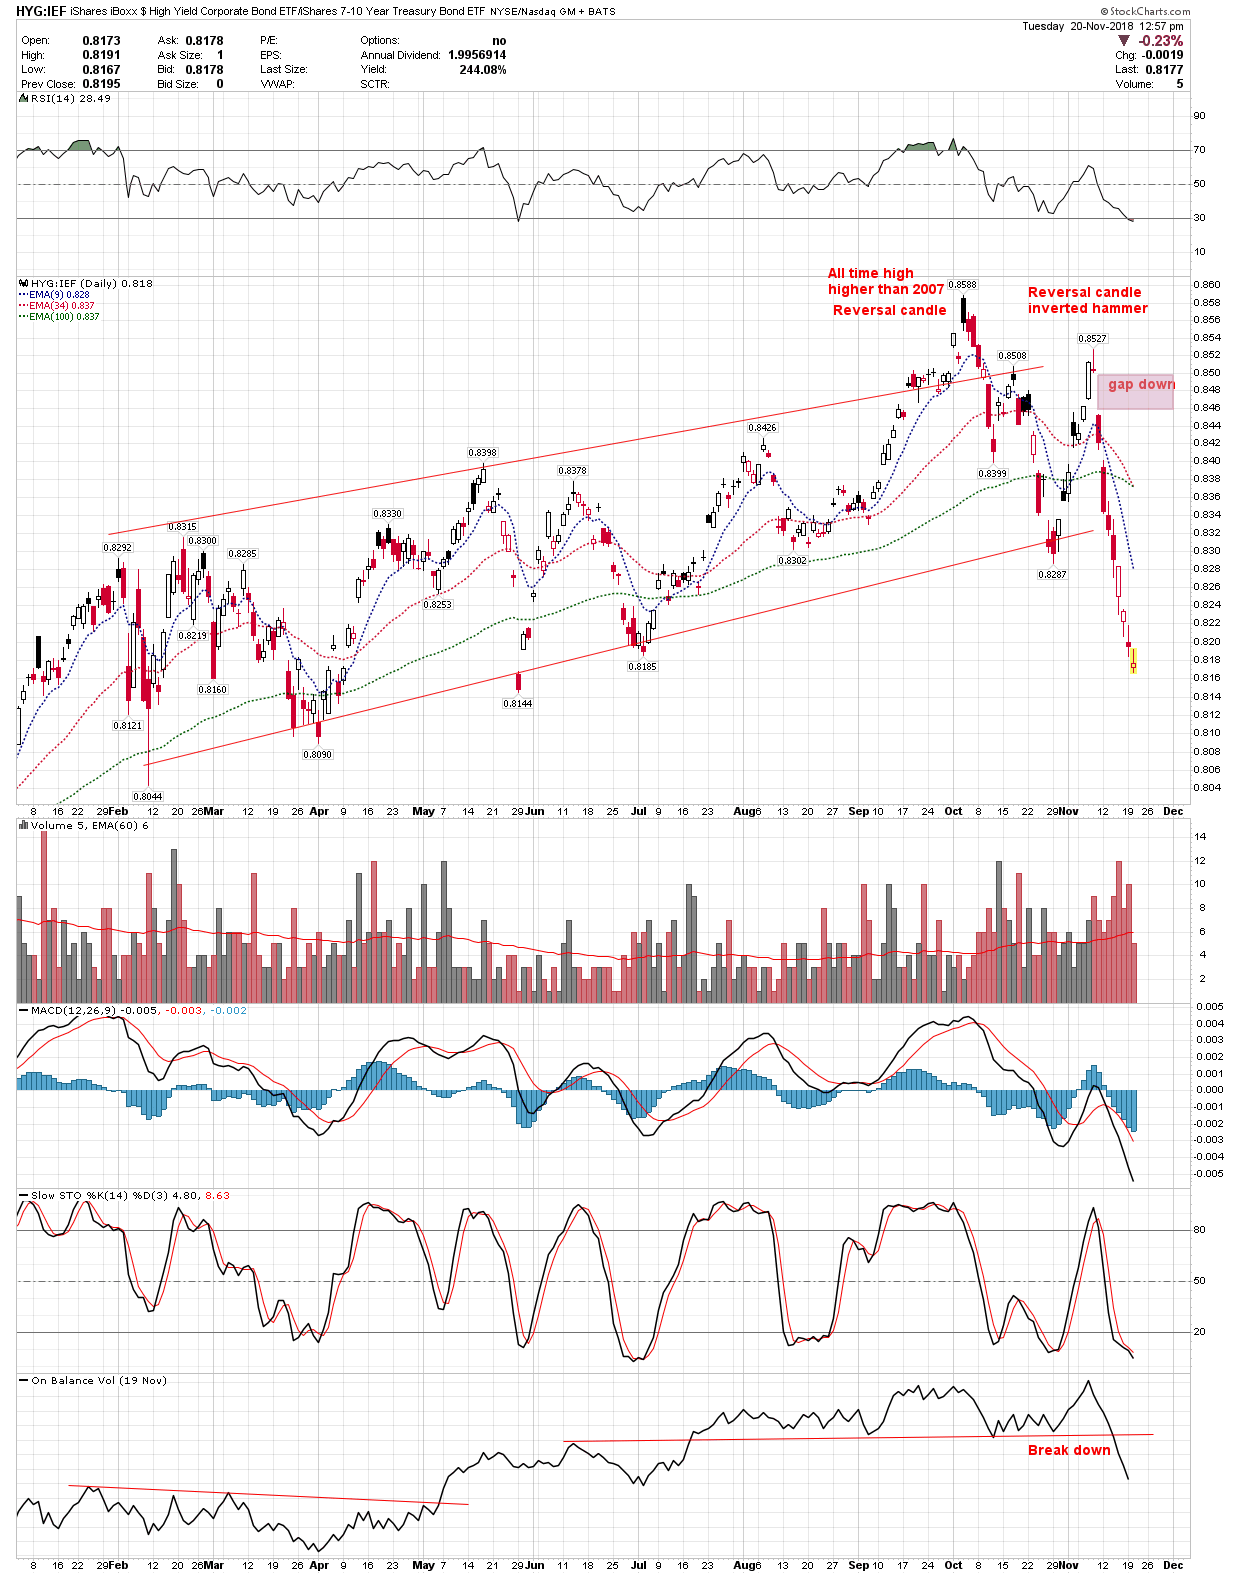
Credit spread is the ratio ( difference in yield) High yield bond to treasury bond.
Below is the chart of HYG to IEF. I have been watching this for market direction and stress along with other indicator.
As ratio goes down the yield spread widens – that happens in bust time????
Warning was given on Nov 16 last wee in my post:
Chart short term chart. Long term chart is as bad as this one???
Your posts are often instructive, Bikoo.
Have included chart in my chart list.
Thanks for posting.
plus 1