* Intermediate Buy Signal on Gold *
I’ve been reading Carl Swenlin for about 15 years. He’s been on the right side of the S & P, Bonds and Gold for most of that time. He’s no “guru” – just a classic technical analyst with basic charting and a couple of indicators that he built, like PMO that’s available on StockCharts.com.
His latest weekly wrap-up in its entirety can be found at the hyperlink below the daily chart of gold.
“GOLD
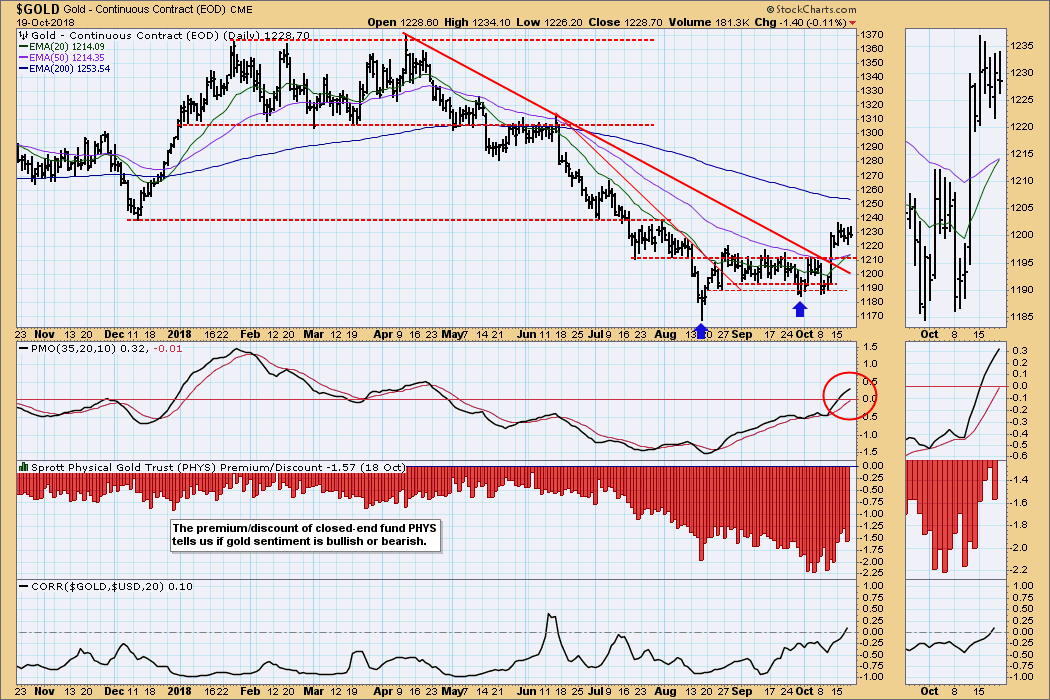
IT Trend Model: BUY as of 10/19/2018
LT Trend Model: SELL as of 6/22/2018
GOLD Daily Chart: Gold is slowly building a bullish case. After a solid breakout, gold has moved into a bullish a flag formation, and the daily PMO is above the zero line and rising. But the big deal today is that the 20EMA crossed up through the 50EMA, generating an IT Trend Model BUY signal. The thing last needed is for sentiment to turn positive, because a rally will not be sustained if sentiment remains bearish.
Interesting stuff. Thanks BBM.