The Gold Cycle
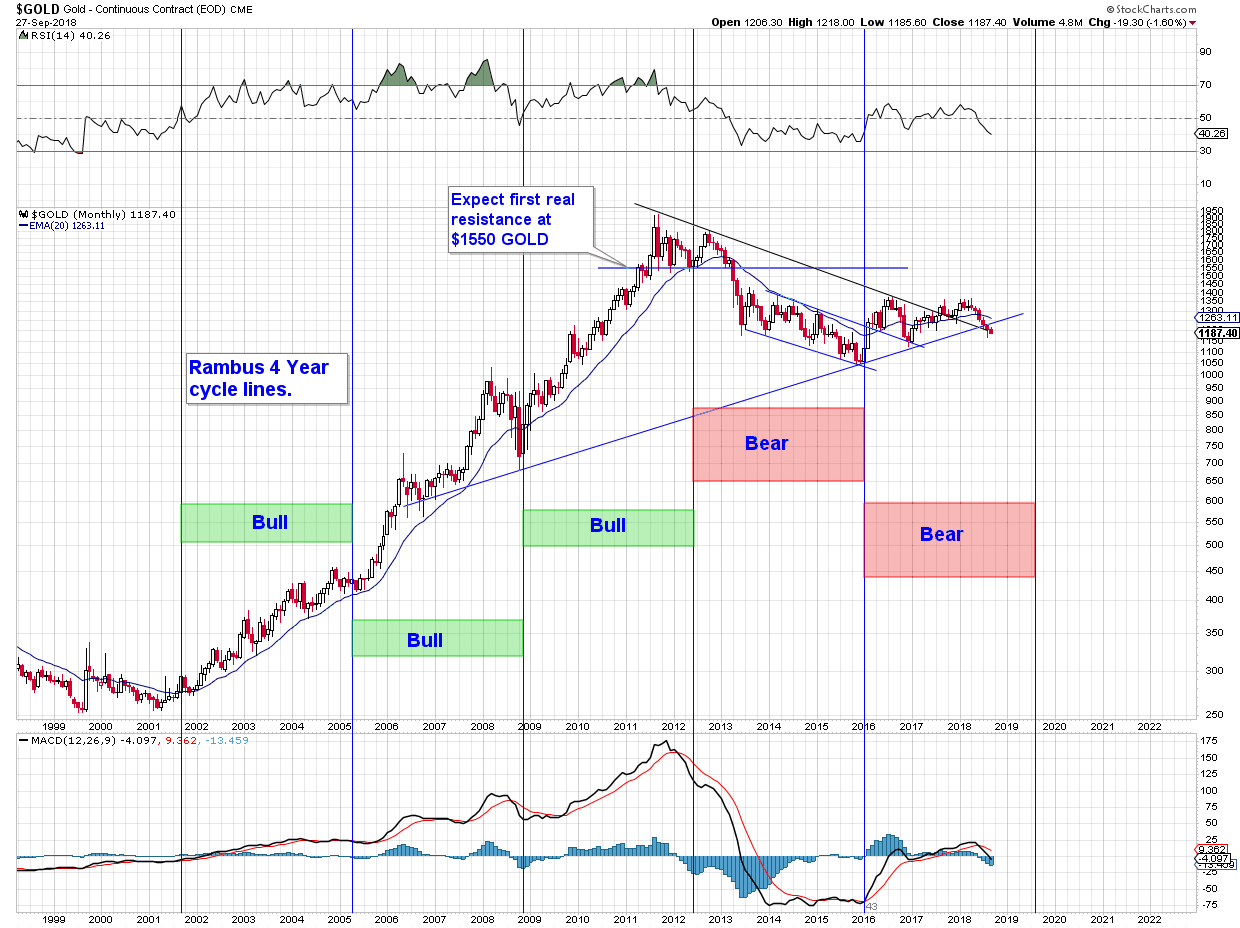
Happened upon this old cycle line Gold chart. It was created a few years ago and long buried in my chart list. Have updated the chart. It was originally posted by Rambus when he was experimenting, I think, with cycle lines. ( hope he doesn’t mind that I post it here ) He called it 4 year cycles, but in fact the lines are spaced at exactly 3 1/2 years. If Gold stays on pattern we should expect it to bottom in 9 months, give or take. Lets say June 2019.
Thanks. This does not look anything like Northstar’s work and confuses me. Eeeny Meeny.:o.
Dollar and Gold are not always mutually exclusive. Sometimes they rally together. Or not. Maybe that helps account for the discrepancy.
Certainly not in agreement with this, but everyone is entitled to their view.
Rambus’s work is in part based on my Cycle work that I was posting on the Rambus Forum back then. Gold definitely has a 4 Year longer cycle (low to low) and the outlook out of the late 2015 YCL is still very much in question as we are nearing the 3 year mark. We have and early top at the 6 month mark with choppy action but price is clearly below the 30ema on the Weekly near 1269. Until we can move above that level, the outcome is still in doubt. Nearer term we appear to be forming a higher short term Trading or Daily cycle which is an indication that Gold did find a longer Intermediate Cycle Low (ICL) in early August.
Thanks Surf.
Makes sense now
Regardless of cycles theory this chart is showing a potentially very important break down